
 Yahoo Finance
 The CF Industries Holdings (NYSE:CF) Share Price Is Up 48% And Shareholders Are Holding On
On average, over time, stock markets tend to rise higher. This makes investing attractive. But if when you choose to buy stocks, some of them will be below average performers. Unfortunately for shareholders, while the CF Industries Holdings, Inc. (NYSE:CF) share price is up 48% in the last year, that falls short of the market return. However, the longer term returns haven't been so impressive, with the stock up just 20% in the last three years.
See our latest analysis for CF Industries Holdings
There is no denying that markets are sometimes efficient, but prices do not always reflect underlying business performance. One flawed but reasonable way to assess how sentiment around a company has changed is to compare the earnings per share (EPS) with the share price.
During the last year, CF Industries Holdings actually saw its earnings per share drop 34%.
This means it's unlikely the market is judging the company based on earnings growth. Indeed, when EPS is declining but the share price is up, it often means the market is considering other factors.
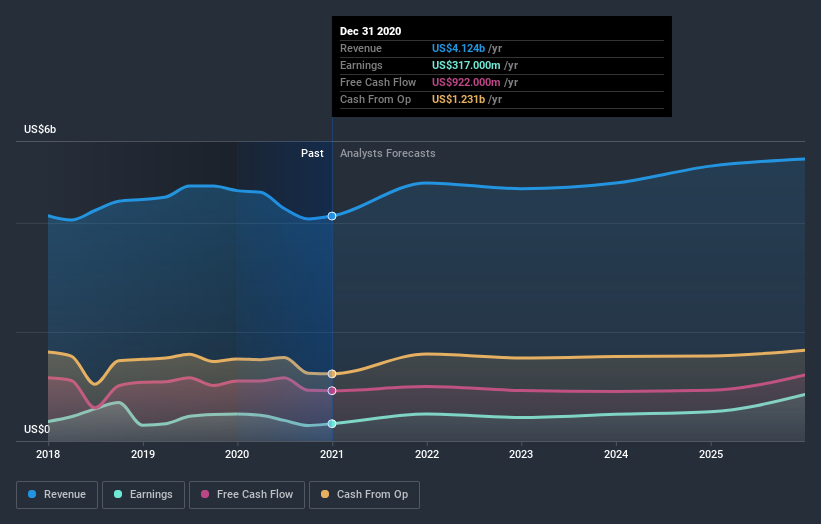
CF Industries Holdings' revenue actually dropped 10% over last year. So the fundamental metrics don't provide an obvious explanation for the share price gain.
The graphic below depicts how earnings and revenue have changed over time (unveil the exact values by clicking on the image).
CF Industries Holdings is a well known stock, with plenty of analyst coverage, suggesting some visibility into future growth. So we recommend checking out this free report showing consensus forecasts
What About Dividends?
As well as measuring the share price return, investors should also consider the total shareholder return (TSR). The TSR incorporates the value of any spin-offs or discounted capital raisings, along with any dividends, based on the assumption that the dividends are reinvested. Arguably, the TSR gives a more comprehensive picture of the return generated by a stock. In the case of CF Industries Holdings, it has a TSR of 54% for the last year. That exceeds its share price return that we previously mentioned. This is largely a result of its dividend payments!
A Different Perspective
CF Industries Holdings shareholders have received returns of 54% over twelve months (even including dividends), which isn't far from the general market return. Most would be happy with a gain, and it helps that the year's return is actually better than the average return over five years, which was 12%. It is possible that management foresight will bring growth well into the future, even if the share price slows down. I find it very interesting to look at share price over the long term as a proxy for business performance. But to truly gain insight, we need to consider other information, too. To that end, you should be aware of the 2 warning signs we've spotted with CF Industries Holdings .
If you would prefer to check out another company -- one with potentially superior financials -- then do not miss this free list of companies that have proven they can grow earnings.
Please note, the market returns quoted in this article reflect the market weighted average returns of stocks that currently trade on US exchanges.
This article by Simply Wall St is general in nature. It does not constitute a recommendation to buy or sell any stock, and does not take account of your objectives, or your financial situation. We aim to bring you long-term focused analysis driven by fundamental data. Note that our analysis may not factor in the latest price-sensitive company announcements or qualitative material. Simply Wall St has no position in any stocks mentioned.
Have feedback on this article? Concerned about the content? Get in touch with us directly. Alternatively, email editorial-team (at) simplywallst.com.
