
 Yahoo Finance
 What Is Chart Industries's (NASDAQ:GTLS) P/E Ratio After Its Share Price Rocketed?

Chart Industries (NASDAQ:GTLS) shareholders are no doubt pleased to see that the share price has had a great month, posting a 31% gain, recovering from prior weakness. However, the annual gain of 2.9% wasn't so impressive.
Assuming no other changes, a sharply higher share price makes a stock less attractive to potential buyers. In the long term, share prices tend to follow earnings per share, but in the short term prices bounce around in response to short term factors (which are not always obvious). So some would prefer to hold off buying when there is a lot of optimism towards a stock. Perhaps the simplest way to get a read on investors' expectations of a business is to look at its Price to Earnings Ratio (PE Ratio). Investors have optimistic expectations of companies with higher P/E ratios, compared to companies with lower P/E ratios.
View our latest analysis for Chart Industries
Does Chart Industries Have A Relatively High Or Low P/E For Its Industry?
We can tell from its P/E ratio of 43.37 that there is some investor optimism about Chart Industries. The image below shows that Chart Industries has a higher P/E than the average (22.9) P/E for companies in the machinery industry.
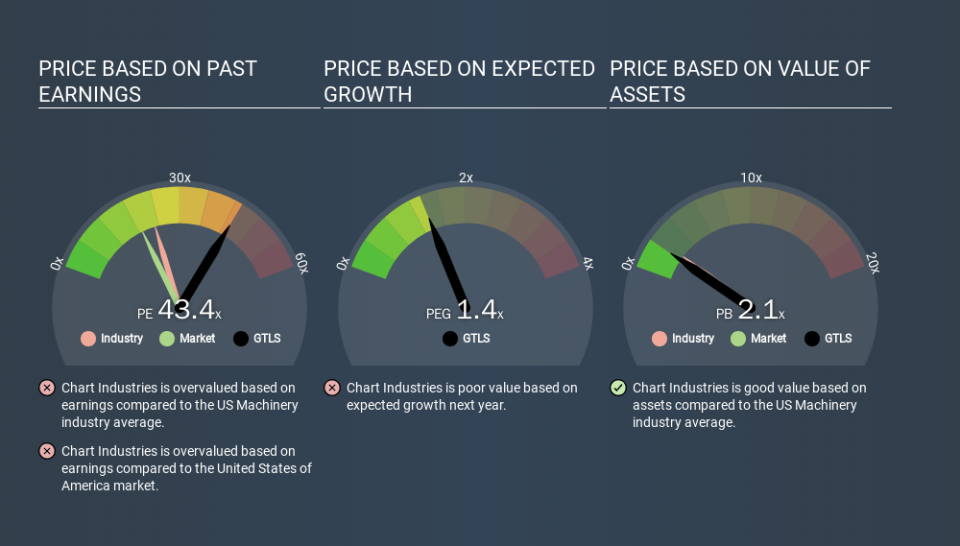
That means that the market expects Chart Industries will outperform other companies in its industry. The market is optimistic about the future, but that doesn't guarantee future growth. So further research is always essential. I often monitor director buying and selling.
How Growth Rates Impact P/E Ratios
P/E ratios primarily reflect market expectations around earnings growth rates. That's because companies that grow earnings per share quickly will rapidly increase the 'E' in the equation. That means even if the current P/E is high, it will reduce over time if the share price stays flat. And as that P/E ratio drops, the company will look cheap, unless its share price increases.
Chart Industries's earnings per share fell by 22% in the last twelve months. And EPS is down 9.2% a year, over the last 5 years. This could justify a pessimistic P/E.
Don't Forget: The P/E Does Not Account For Debt or Bank Deposits
Don't forget that the P/E ratio considers market capitalization. That means it doesn't take debt or cash into account. Hypothetically, a company could reduce its future P/E ratio by spending its cash (or taking on debt) to achieve higher earnings.
While growth expenditure doesn't always pay off, the point is that it is a good option to have; but one that the P/E ratio ignores.
Is Debt Impacting Chart Industries's P/E?
Net debt is 30% of Chart Industries's market cap. While it's worth keeping this in mind, it isn't a worry.
The Verdict On Chart Industries's P/E Ratio
Chart Industries trades on a P/E ratio of 43.4, which is above its market average of 18.9. With some debt but no EPS growth last year, the market has high expectations of future profits. What we know for sure is that investors have become much more excited about Chart Industries recently, since they have pushed its P/E ratio from 33.0 to 43.4 over the last month. If you like to buy stocks that have recently impressed the market, then this one might be a candidate; but if you prefer to invest when there is 'blood in the streets', then you may feel the opportunity has passed.
Investors should be looking to buy stocks that the market is wrong about. As value investor Benjamin Graham famously said, 'In the short run, the market is a voting machine but in the long run, it is a weighing machine. So this free report on the analyst consensus forecasts could help you make a master move on this stock.
Of course, you might find a fantastic investment by looking at a few good candidates. So take a peek at this free list of companies with modest (or no) debt, trading on a P/E below 20.
If you spot an error that warrants correction, please contact the editor at editorial-team@simplywallst.com. This article by Simply Wall St is general in nature. It does not constitute a recommendation to buy or sell any stock, and does not take account of your objectives, or your financial situation. Simply Wall St has no position in the stocks mentioned.
We aim to bring you long-term focused research analysis driven by fundamental data. Note that our analysis may not factor in the latest price-sensitive company announcements or qualitative material. Thank you for reading.
