
 Yahoo Finance
 Charter Communications' (NASDAQ:CHTR) investors will be pleased with their splendid 174% return over the last five years
When you buy shares in a company, it's worth keeping in mind the possibility that it could fail, and you could lose your money. But on a lighter note, a good company can see its share price rise well over 100%. For example, the Charter Communications, Inc. (NASDAQ:CHTR) share price has soared 174% in the last half decade. Most would be very happy with that. Then again, the 8.6% share price decline hasn't been so fun for shareholders. This could be related to the soft market, with stocks down around 0.2% in the last month.
Now it's worth having a look at the company's fundamentals too, because that will help us determine if the long term shareholder return has matched the performance of the underlying business.
Check out our latest analysis for Charter Communications
In his essay The Superinvestors of Graham-and-Doddsville Warren Buffett described how share prices do not always rationally reflect the value of a business. One way to examine how market sentiment has changed over time is to look at the interaction between a company's share price and its earnings per share (EPS).
During five years of share price growth, Charter Communications actually saw its EPS drop 4.2% per year.
So it's hard to argue that the earnings per share are the best metric to judge the company, as it may not be optimized for profits at this point. Since the change in EPS doesn't seem to correlate with the change in share price, it's worth taking a look at other metrics.
In contrast revenue growth of 12% per year is probably viewed as evidence that Charter Communications is growing, a real positive. In that case, the company may be sacrificing current earnings per share to drive growth.
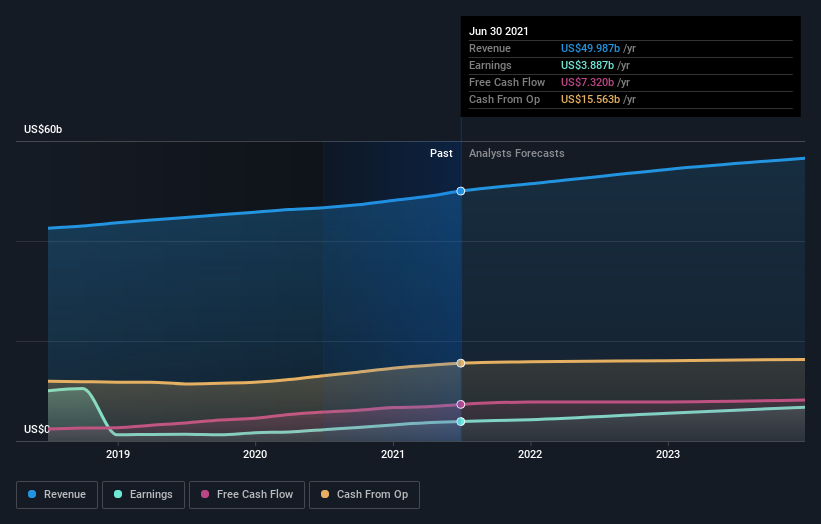
The company's revenue and earnings (over time) are depicted in the image below (click to see the exact numbers).
Charter Communications is well known by investors, and plenty of clever analysts have tried to predict the future profit levels. If you are thinking of buying or selling Charter Communications stock, you should check out this free report showing analyst consensus estimates for future profits.
A Different Perspective
Charter Communications provided a TSR of 10% over the last twelve months. But that return falls short of the market. It's probably a good sign that the company has an even better long term track record, having provided shareholders with an annual TSR of 22% over five years. Maybe the share price is just taking a breather while the business executes on its growth strategy. I find it very interesting to look at share price over the long term as a proxy for business performance. But to truly gain insight, we need to consider other information, too. Case in point: We've spotted 1 warning sign for Charter Communications you should be aware of.
If you like to buy stocks alongside management, then you might just love this free list of companies. (Hint: insiders have been buying them).
Please note, the market returns quoted in this article reflect the market weighted average returns of stocks that currently trade on US exchanges.
This article by Simply Wall St is general in nature. We provide commentary based on historical data and analyst forecasts only using an unbiased methodology and our articles are not intended to be financial advice. It does not constitute a recommendation to buy or sell any stock, and does not take account of your objectives, or your financial situation. We aim to bring you long-term focused analysis driven by fundamental data. Note that our analysis may not factor in the latest price-sensitive company announcements or qualitative material. Simply Wall St has no position in any stocks mentioned.
Have feedback on this article? Concerned about the content? Get in touch with us directly. Alternatively, email editorial-team (at) simplywallst.com.
