
 Yahoo Finance
 In charts: the FTSE keeps rising – can it last?
Fears of a stock market correction are reaching fever pitch as valuations reach successive new highs.
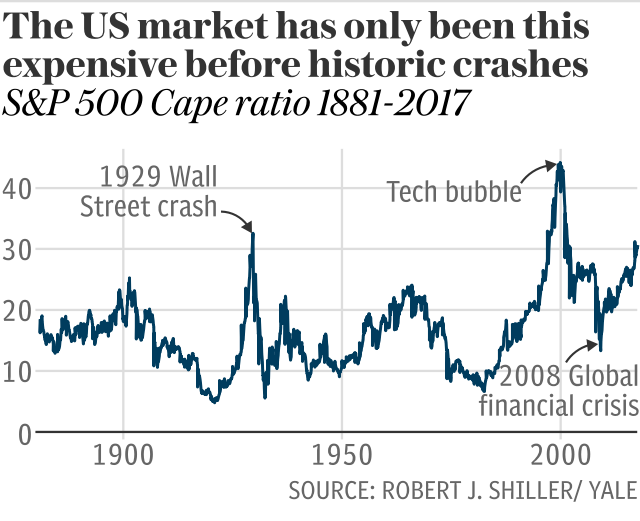
American markets - which influence investors everywhere - have not been this expensive since the 1929 Wall Street Crash and the bursting of the "tech bubble" in 2000.
Professional investors are hoarding cash in their portfolios in anticipation of a fall. But is this trepidation justified?
Telegraph Money has pulled together some key charts and metrics to explore what is likely to come next for Isa and pension investors.
The UK market does not exist in isolation from the US, which accounts for half of the world's markets by size, and which sets the tone. If it crashed, the UK would almost certainly follow.
Many British firms - particularly those in the FTSE 100 - also derive a high proportion of their earnings from overseas, so are not solely dependent on the domestic economy.
According to investment firm Star Capital, the UK market currently sits at a price-to-earnings ratio of 23, significantly above the long-term average of 15. However, when the market's "Cape" score or future earnings are looked at, the picture changes.
Cape is another version of the price-to-earnings metric, but compares the average earnings over the past 10 years to today's share price, with inflation accounted for. This is intended to smooth out the ups and downs of the business cycle.
The UK's score of 16 is around the level it has been for the past seven years, and is below its 20-year average.
Additionally, FTSE 100 earnings are expected to soar. They collapsed to £84bn in 2015 and £96bn in 2016, after the fall in the price of commodities hurt oil and mining firms, which make up a large part of the index.
This year, they are expected to hit £191bn, and in 2018 that figure is expected to rise again to £213bn, according to data provided by fund shop AJ Bell.
Unless the market rises rapidly in tandem, or the estimates prove inaccurate, this will bring the price-to-earnings ratio back down towards the longer term average.
Laith Khalaf, of fund shop Hargreaves Lansdown, said: "When earnings are factored in, valuations in the UK market look reasonable - not cheap, nor expensive. That means in the short term, the stock market can turn in either direction without defying the laws of statistics."
Comparing market value (the total size of a market) with GDP (gross domestic product) is one of legendary investor Warren Buffett's favourite metrics.
Russ Mould, of AJ Bell, said while companies can fiddle or embellish their own numbers, they can't do so to official statistics such as GDP - which measures the value of all goods and services produced by a country.
The ratio of market cap to GDP is now approaching record highs. It currently stands at 113pc, compared to 131pc at the height of the tech bubble, and 114pc in 2007. The average over the past 29 years is 87pc.
"This is fair enough, as the ratio of corporate profits to GDP is also at a record high," said Mr Mould.
But that means corporate profits have to stay where they are to ensure the index maintains its current level, and the ratio of earnings to GDP would have to move higher for the market to rise.
He said over half of the FTSE 100's forecast earnings come from banks, insurers, miners and oil firms - all of which should benefit if the global economy remains buoyant, and interest rates head upwards.
"Anyone who believes that Donald Trump's policies will lead to higher US growth, central banks bending the economy to their iron will, or that governments are about to start spending again, will feel comfortable with this," he said.
Low confidence and wage growth
Not all the data is so optimistic. Consumer confidence measures how positive ordinary people feel about the state of the economy, and their own finances.
Typically, the more optimistic consumers are, the more they tend to spend on both goods and services, which stimulates the economy and boosts markets.
Mike Bell, a market strategist at JP Morgan Asset Management, said that historically, a sharp fall in consumer confidence and then retail sales has been seen before recessions.
"Right now you are seeing falling consumer confidence. It is not yet in the territory that has previously indicated a recession, but it does indicate that UK economic growth is likely to be quite weak," he said.
House price growth has also been weak recently, meaning "the boom in consumer spending you get when house prices go up won't be present".
While wage growth is much stronger than during the financial crisis, it has flatlined at around 2pc.
"This was OK when inflation was weak, but now as inflation has overtaken earnings - helped by the weaker pound - we have a consumer spending squeeze," said Chris Beauchamp of trading service IG.
In other words, while wages are still growing, the price of goods and services is rising at a faster rate.
If all of these factors drive down spending by UK consumers, it will hit company earnings. Retailers and housebuilders, and other domestically focused businesses, would be especially affected.
Mr Bell highlighted that the average UK fund has 43pc exposure to more domestically focused small and medium-sized stocks, compared with the market weighting of 19pc.
Dividends under threat
The dividend yield of the FTSE 100 index as a whole stands at 3.8pc.
"That figure easily beats anything that can be obtained from developed market government bonds, which supports share prices as income investors choose to put their money into stocks instead of bonds," said Mr Mould.
However, while the yield is attractive, dividend cover - which measures the ability of firms to pay dividends from profits alone - is historically low.
Mr Mould said ideally investors want to see dividend cover of two or more, which provides some safety in the event of a sudden shock.
FTSE 100 dividend cover is estimated at 1.6 to 1.7 for 2018, and many of the highest-yielding firms have cover significantly lower.
As has been seen recently with Pearson, Provident Financial and Admiral, when this goes wrong and a dividend has to be cut, it can have severe ramifications for the share price.

So what?
Mr Bell said: "With all the data we have, we struggle to see where the UK is going. By comparison, we have strong conviction that Europe and the US have a positive outlook.
"The UK is mixed: low unemployment coupled with weak consumer confidence, for instance. That's before you start contemplating the Brexit negotiations."
He added that while a no-deal Brexit would be bad, it would not necessarily be bad for stock markets, as the pound would fall sharply again, boosting overseas earnings.
The value of sterling will remain an ever-present factor affecting UK returns, as around 70pc of FTSE 100 earnings are from overseas.
The role of central banks remains important too. The money they have pumped into markets since 2008, and rock-bottom interest rates, continue to provide support to stock markets. The removal of such stimulus is likely to be handled very cautiously, but is uncharted territory.
Follow us for more investing ideas: @TelegraphInvest
For investment tips and ideas five days a week, read Questor
