
 Yahoo Finance
 Check Point Software Technologies' (NASDAQ:CHKP) 9.3% CAGR outpaced the company's earnings growth over the same five-year period
The main point of investing for the long term is to make money. Furthermore, you'd generally like to see the share price rise faster than the market. Unfortunately for shareholders, while the Check Point Software Technologies Ltd. (NASDAQ:CHKP) share price is up 56% in the last five years, that's less than the market return. Unfortunately the share price is down 4.2% in the last year.
The past week has proven to be lucrative for Check Point Software Technologies investors, so let's see if fundamentals drove the company's five-year performance.
View our latest analysis for Check Point Software Technologies
In his essay The Superinvestors of Graham-and-Doddsville Warren Buffett described how share prices do not always rationally reflect the value of a business. By comparing earnings per share (EPS) and share price changes over time, we can get a feel for how investor attitudes to a company have morphed over time.
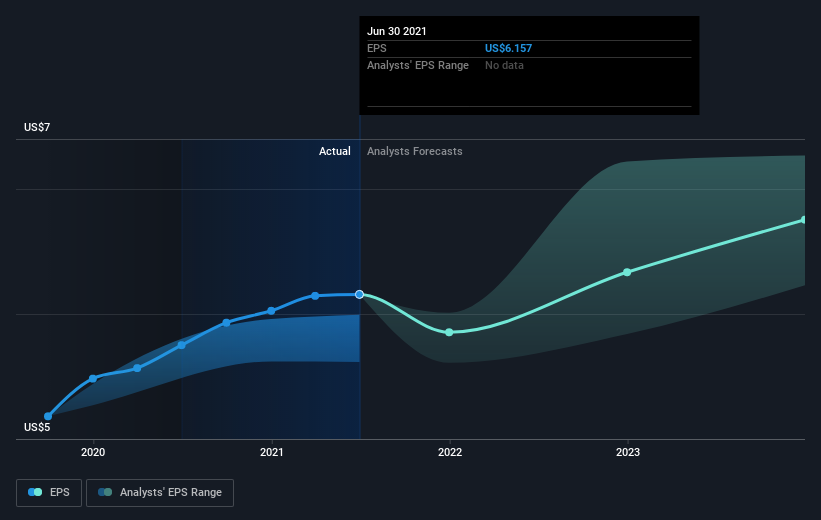
During five years of share price growth, Check Point Software Technologies achieved compound earnings per share (EPS) growth of 9.7% per year. This EPS growth is remarkably close to the 9% average annual increase in the share price. This indicates that investor sentiment towards the company has not changed a great deal. Rather, the share price has approximately tracked EPS growth.
You can see below how EPS has changed over time (discover the exact values by clicking on the image).
It's probably worth noting that the CEO is paid less than the median at similar sized companies. It's always worth keeping an eye on CEO pay, but a more important question is whether the company will grow earnings throughout the years. This free interactive report on Check Point Software Technologies' earnings, revenue and cash flow is a great place to start, if you want to investigate the stock further.
A Different Perspective
Investors in Check Point Software Technologies had a tough year, with a total loss of 4.2%, against a market gain of about 29%. Even the share prices of good stocks drop sometimes, but we want to see improvements in the fundamental metrics of a business, before getting too interested. Longer term investors wouldn't be so upset, since they would have made 9%, each year, over five years. It could be that the recent sell-off is an opportunity, so it may be worth checking the fundamental data for signs of a long term growth trend. Before forming an opinion on Check Point Software Technologies you might want to consider these 3 valuation metrics.
But note: Check Point Software Technologies may not be the best stock to buy. So take a peek at this free list of interesting companies with past earnings growth (and further growth forecast).
Please note, the market returns quoted in this article reflect the market weighted average returns of stocks that currently trade on US exchanges.
This article by Simply Wall St is general in nature. We provide commentary based on historical data and analyst forecasts only using an unbiased methodology and our articles are not intended to be financial advice. It does not constitute a recommendation to buy or sell any stock, and does not take account of your objectives, or your financial situation. We aim to bring you long-term focused analysis driven by fundamental data. Note that our analysis may not factor in the latest price-sensitive company announcements or qualitative material. Simply Wall St has no position in any stocks mentioned.
Have feedback on this article? Concerned about the content? Get in touch with us directly. Alternatively, email editorial-team (at) simplywallst.com.
