
 Yahoo Finance
 Checkit plc's (LON:CKT) Shares May Have Run Too Fast Too Soon
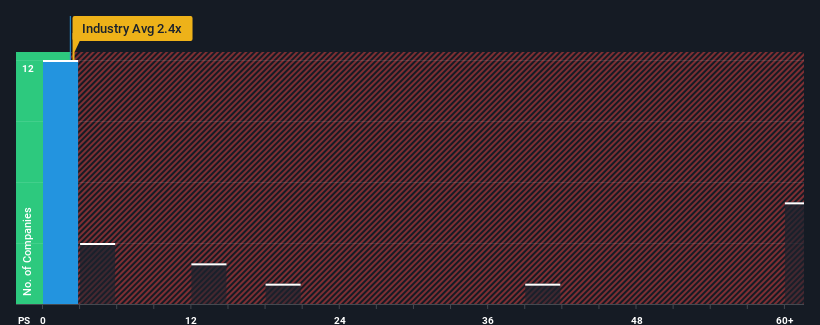
It's not a stretch to say that Checkit plc's (LON:CKT) price-to-sales (or "P/S") ratio of 2.2x right now seems quite "middle-of-the-road" for companies in the Electrical industry in the United Kingdom, where the median P/S ratio is around 2.4x. However, investors might be overlooking a clear opportunity or potential setback if there is no rational basis for the P/S.
View our latest analysis for Checkit
What Does Checkit's Recent Performance Look Like?
With revenue growth that's superior to most other companies of late, Checkit has been doing relatively well. It might be that many expect the strong revenue performance to wane, which has kept the P/S ratio from rising. If you like the company, you'd be hoping this isn't the case so that you could potentially pick up some stock while it's not quite in favour.
If you'd like to see what analysts are forecasting going forward, you should check out our free report on Checkit.
Do Revenue Forecasts Match The P/S Ratio?
There's an inherent assumption that a company should be matching the industry for P/S ratios like Checkit's to be considered reasonable.
Retrospectively, the last year delivered an exceptional 111% gain to the company's top line. Despite this strong recent growth, it's still struggling to catch up as its three-year revenue frustratingly shrank by 14% overall. Accordingly, shareholders would have felt downbeat about the medium-term rates of revenue growth.
Looking ahead now, revenue is anticipated to climb by 17% during the coming year according to the dual analysts following the company. Meanwhile, the rest of the industry is forecast to expand by 84%, which is noticeably more attractive.
With this in mind, we find it intriguing that Checkit's P/S is closely matching its industry peers. It seems most investors are ignoring the fairly limited growth expectations and are willing to pay up for exposure to the stock. Maintaining these prices will be difficult to achieve as this level of revenue growth is likely to weigh down the shares eventually.
What We Can Learn From Checkit's P/S?
We'd say the price-to-sales ratio's power isn't primarily as a valuation instrument but rather to gauge current investor sentiment and future expectations.
Our look at the analysts forecasts of Checkit's revenue prospects has shown that its inferior revenue outlook isn't negatively impacting its P/S as much as we would have predicted. When we see companies with a relatively weaker revenue outlook compared to the industry, we suspect the share price is at risk of declining, sending the moderate P/S lower. This places shareholders' investments at risk and potential investors in danger of paying an unnecessary premium.
It is also worth noting that we have found 2 warning signs for Checkit that you need to take into consideration.
It's important to make sure you look for a great company, not just the first idea you come across. So if growing profitability aligns with your idea of a great company, take a peek at this free list of interesting companies with strong recent earnings growth (and a low P/E).
Have feedback on this article? Concerned about the content? Get in touch with us directly. Alternatively, email editorial-team (at) simplywallst.com.
This article by Simply Wall St is general in nature. We provide commentary based on historical data and analyst forecasts only using an unbiased methodology and our articles are not intended to be financial advice. It does not constitute a recommendation to buy or sell any stock, and does not take account of your objectives, or your financial situation. We aim to bring you long-term focused analysis driven by fundamental data. Note that our analysis may not factor in the latest price-sensitive company announcements or qualitative material. Simply Wall St has no position in any stocks mentioned.
