
 Yahoo Finance
 Cheer Holding (NASDAQ:CHR) Will Want To Turn Around Its Return Trends
If you're looking for a multi-bagger, there's a few things to keep an eye out for. One common approach is to try and find a company with returns on capital employed (ROCE) that are increasing, in conjunction with a growing amount of capital employed. Basically this means that a company has profitable initiatives that it can continue to reinvest in, which is a trait of a compounding machine. Although, when we looked at Cheer Holding (NASDAQ:CHR), it didn't seem to tick all of these boxes.
Return On Capital Employed (ROCE): What Is It?
For those that aren't sure what ROCE is, it measures the amount of pre-tax profits a company can generate from the capital employed in its business. The formula for this calculation on Cheer Holding is:
Return on Capital Employed = Earnings Before Interest and Tax (EBIT) ÷ (Total Assets - Current Liabilities)
0.10 = US$29m ÷ (US$328m - US$46m) (Based on the trailing twelve months to December 2023).
Thus, Cheer Holding has an ROCE of 10%. In absolute terms, that's a satisfactory return, but compared to the Interactive Media and Services industry average of 7.1% it's much better.
View our latest analysis for Cheer Holding
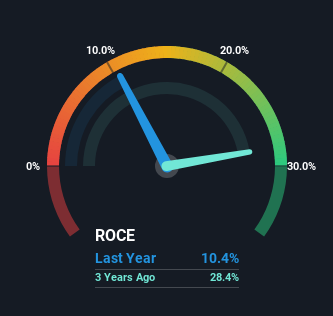
Historical performance is a great place to start when researching a stock so above you can see the gauge for Cheer Holding's ROCE against it's prior returns. If you're interested in investigating Cheer Holding's past further, check out this free graph covering Cheer Holding's past earnings, revenue and cash flow.
The Trend Of ROCE
Unfortunately, the trend isn't great with ROCE falling from 41% five years ago, while capital employed has grown 751%. Usually this isn't ideal, but given Cheer Holding conducted a capital raising before their most recent earnings announcement, that would've likely contributed, at least partially, to the increased capital employed figure. Cheer Holding probably hasn't received a full year of earnings yet from the new funds it raised, so these figures should be taken with a grain of salt. It's also worth noting the company's latest EBIT figure is within 10% of the previous year, so it's fair to assign the ROCE drop largely to the capital raise.
On a side note, Cheer Holding has done well to pay down its current liabilities to 14% of total assets. That could partly explain why the ROCE has dropped. Effectively this means their suppliers or short-term creditors are funding less of the business, which reduces some elements of risk. Since the business is basically funding more of its operations with it's own money, you could argue this has made the business less efficient at generating ROCE.
The Bottom Line On Cheer Holding's ROCE
To conclude, we've found that Cheer Holding is reinvesting in the business, but returns have been falling. Moreover, since the stock has crumbled 91% over the last three years, it appears investors are expecting the worst. On the whole, we aren't too inspired by the underlying trends and we think there may be better chances of finding a multi-bagger elsewhere.
One more thing, we've spotted 3 warning signs facing Cheer Holding that you might find interesting.
While Cheer Holding isn't earning the highest return, check out this free list of companies that are earning high returns on equity with solid balance sheets.
Have feedback on this article? Concerned about the content? Get in touch with us directly. Alternatively, email editorial-team (at) simplywallst.com.
This article by Simply Wall St is general in nature. We provide commentary based on historical data and analyst forecasts only using an unbiased methodology and our articles are not intended to be financial advice. It does not constitute a recommendation to buy or sell any stock, and does not take account of your objectives, or your financial situation. We aim to bring you long-term focused analysis driven by fundamental data. Note that our analysis may not factor in the latest price-sensitive company announcements or qualitative material. Simply Wall St has no position in any stocks mentioned.
