
 Yahoo Finance
 Chemours (NYSE:CC) pulls back 3.8% this week, but still delivers shareholders solid 37% CAGR over 3 years
The most you can lose on any stock (assuming you don't use leverage) is 100% of your money. But in contrast you can make much more than 100% if the company does well. To wit, the The Chemours Company (NYSE:CC) share price has flown 127% in the last three years. Most would be happy with that. On the other hand, the stock price has retraced 3.8% in the last week. However, this might be related to the overall market decline of 2.8% in a week.
Since the long term performance has been good but there's been a recent pullback of 3.8%, let's check if the fundamentals match the share price.
See our latest analysis for Chemours
To quote Buffett, 'Ships will sail around the world but the Flat Earth Society will flourish. There will continue to be wide discrepancies between price and value in the marketplace...' One way to examine how market sentiment has changed over time is to look at the interaction between a company's share price and its earnings per share (EPS).
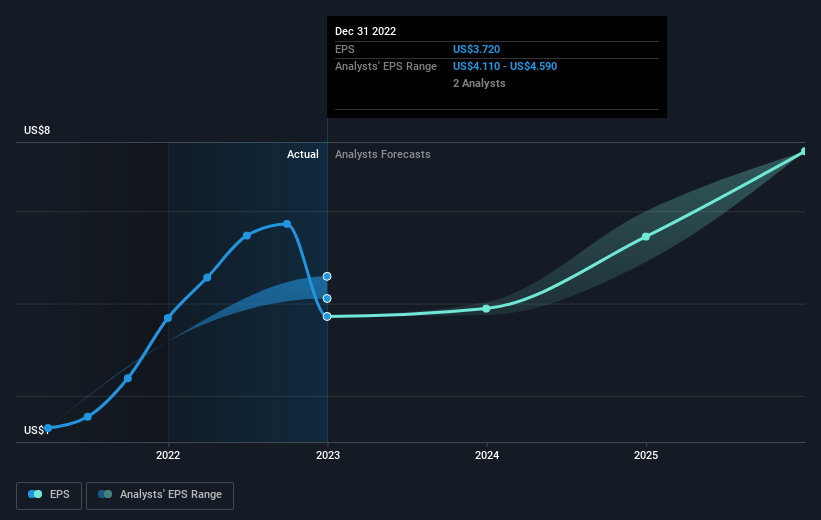
Chemours became profitable within the last three years. Given the importance of this milestone, it's not overly surprising that the share price has increased strongly.
The graphic below depicts how EPS has changed over time (unveil the exact values by clicking on the image).
We know that Chemours has improved its bottom line over the last three years, but what does the future have in store? If you are thinking of buying or selling Chemours stock, you should check out this FREE detailed report on its balance sheet.
What About Dividends?
As well as measuring the share price return, investors should also consider the total shareholder return (TSR). The TSR is a return calculation that accounts for the value of cash dividends (assuming that any dividend received was reinvested) and the calculated value of any discounted capital raisings and spin-offs. Arguably, the TSR gives a more comprehensive picture of the return generated by a stock. In the case of Chemours, it has a TSR of 155% for the last 3 years. That exceeds its share price return that we previously mentioned. This is largely a result of its dividend payments!
A Different Perspective
It's good to see that Chemours has rewarded shareholders with a total shareholder return of 21% in the last twelve months. That's including the dividend. There's no doubt those recent returns are much better than the TSR loss of 3% per year over five years. This makes us a little wary, but the business might have turned around its fortunes. It's always interesting to track share price performance over the longer term. But to understand Chemours better, we need to consider many other factors. Consider risks, for instance. Every company has them, and we've spotted 2 warning signs for Chemours you should know about.
For those who like to find winning investments this free list of growing companies with recent insider purchasing, could be just the ticket.
Please note, the market returns quoted in this article reflect the market weighted average returns of stocks that currently trade on US exchanges.
Have feedback on this article? Concerned about the content? Get in touch with us directly. Alternatively, email editorial-team (at) simplywallst.com.
This article by Simply Wall St is general in nature. We provide commentary based on historical data and analyst forecasts only using an unbiased methodology and our articles are not intended to be financial advice. It does not constitute a recommendation to buy or sell any stock, and does not take account of your objectives, or your financial situation. We aim to bring you long-term focused analysis driven by fundamental data. Note that our analysis may not factor in the latest price-sensitive company announcements or qualitative material. Simply Wall St has no position in any stocks mentioned.
Join A Paid User Research Session
You’ll receive a US$30 Amazon Gift card for 1 hour of your time while helping us build better investing tools for the individual investors like yourself. Sign up here
