
 Yahoo Finance
 China Kangda Food's (SGX:P74) Returns On Capital Tell Us There Is Reason To Feel Uneasy
If you're looking at a mature business that's past the growth phase, what are some of the underlying trends that pop up? More often than not, we'll see a declining return on capital employed (ROCE) and a declining amount of capital employed. This indicates the company is producing less profit from its investments and its total assets are decreasing. So after glancing at the trends within China Kangda Food (SGX:P74), we weren't too hopeful.
Understanding Return On Capital Employed (ROCE)
For those that aren't sure what ROCE is, it measures the amount of pre-tax profits a company can generate from the capital employed in its business. To calculate this metric for China Kangda Food, this is the formula:
Return on Capital Employed = Earnings Before Interest and Tax (EBIT) ÷ (Total Assets - Current Liabilities)
0.005 = CN¥3.1m ÷ (CN¥1.5b - CN¥889m) (Based on the trailing twelve months to June 2023).
So, China Kangda Food has an ROCE of 0.5%. In absolute terms, that's a low return and it also under-performs the Food industry average of 12%.
View our latest analysis for China Kangda Food
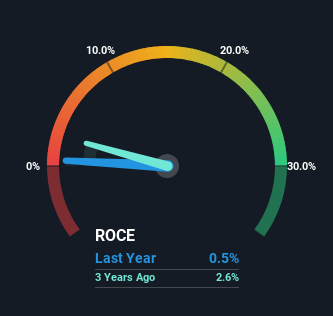
Historical performance is a great place to start when researching a stock so above you can see the gauge for China Kangda Food's ROCE against it's prior returns. If you're interested in investigating China Kangda Food's past further, check out this free graph of past earnings, revenue and cash flow.
So How Is China Kangda Food's ROCE Trending?
In terms of China Kangda Food's historical ROCE movements, the trend doesn't inspire confidence. Unfortunately the returns on capital have diminished from the 1.9% that they were earning five years ago. Meanwhile, capital employed in the business has stayed roughly the flat over the period. Companies that exhibit these attributes tend to not be shrinking, but they can be mature and facing pressure on their margins from competition. So because these trends aren't typically conducive to creating a multi-bagger, we wouldn't hold our breath on China Kangda Food becoming one if things continue as they have.
On a side note, China Kangda Food's current liabilities are still rather high at 59% of total assets. This can bring about some risks because the company is basically operating with a rather large reliance on its suppliers or other sorts of short-term creditors. Ideally we'd like to see this reduce as that would mean fewer obligations bearing risks.
Our Take On China Kangda Food's ROCE
In summary, it's unfortunate that China Kangda Food is generating lower returns from the same amount of capital. It should come as no surprise then that the stock has fallen 19% over the last three years, so it looks like investors are recognizing these changes. Unless there is a shift to a more positive trajectory in these metrics, we would look elsewhere.
If you want to continue researching China Kangda Food, you might be interested to know about the 3 warning signs that our analysis has discovered.
While China Kangda Food may not currently earn the highest returns, we've compiled a list of companies that currently earn more than 25% return on equity. Check out this free list here.
Have feedback on this article? Concerned about the content? Get in touch with us directly. Alternatively, email editorial-team (at) simplywallst.com.
This article by Simply Wall St is general in nature. We provide commentary based on historical data and analyst forecasts only using an unbiased methodology and our articles are not intended to be financial advice. It does not constitute a recommendation to buy or sell any stock, and does not take account of your objectives, or your financial situation. We aim to bring you long-term focused analysis driven by fundamental data. Note that our analysis may not factor in the latest price-sensitive company announcements or qualitative material. Simply Wall St has no position in any stocks mentioned.
