
 Yahoo Finance
 Some Christie Group (LON:CTG) Shareholders Are Down 32%

It's easy to match the overall market return by buying an index fund. While individual stocks can be big winners, plenty more fail to generate satisfactory returns. Investors in Christie Group plc (LON:CTG) have tasted that bitter downside in the last year, as the share price dropped 32%. That contrasts poorly with the market return of 2.8%. On the bright side, the stock is actually up 27% in the last three years.
View our latest analysis for Christie Group
While the efficient markets hypothesis continues to be taught by some, it has been proven that markets are over-reactive dynamic systems, and investors are not always rational. One way to examine how market sentiment has changed over time is to look at the interaction between a company's share price and its earnings per share (EPS).
During the unfortunate twelve months during which the Christie Group share price fell, it actually saw its earnings per share (EPS) improve by 19%. Of course, the situation might betray previous over-optimism about growth. It's surprising to see the share price fall so much, despite the improved EPS. But we might find some different metrics explain the share price movements better.
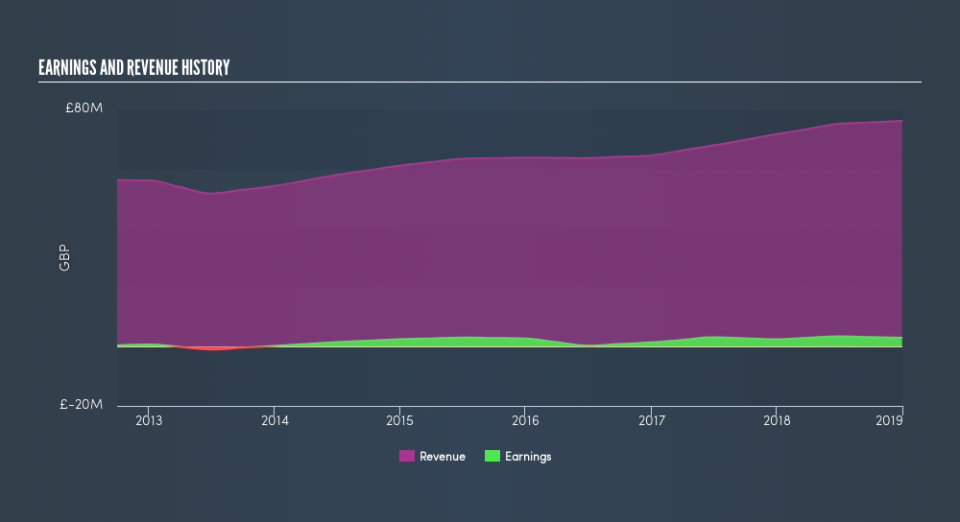
Christie Group's revenue is actually up 6.2% over the last year. Since the fundamental metrics don't readily explain the share price drop, there might be an opportunity if the market has overreacted.
The company's revenue and earnings (over time) are depicted in the image below (click to see the exact numbers).
You can see how its balance sheet has strengthened (or weakened) over time in this free interactive graphic.
What About Dividends?
When looking at investment returns, it is important to consider the difference between total shareholder return (TSR) and share price return. Whereas the share price return only reflects the change in the share price, the TSR includes the value of dividends (assuming they were reinvested) and the benefit of any discounted capital raising or spin-off. So for companies that pay a generous dividend, the TSR is often a lot higher than the share price return. In the case of Christie Group, it has a TSR of -30% for the last year. That exceeds its share price return that we previously mentioned. This is largely a result of its dividend payments!
A Different Perspective
Christie Group shareholders are down 30% for the year (even including dividends), but the market itself is up 2.8%. However, keep in mind that even the best stocks will sometimes underperform the market over a twelve month period. Regrettably, last year's performance caps off a bad run, with the shareholders facing a total loss of 2.8% per year over five years. Generally speaking long term share price weakness can be a bad sign, though contrarian investors might want to research the stock in hope of a turnaround. Most investors take the time to check the data on insider transactions. You can click here to see if insiders have been buying or selling.
But note: Christie Group may not be the best stock to buy. So take a peek at this free list of interesting companies with past earnings growth (and further growth forecast).
Please note, the market returns quoted in this article reflect the market weighted average returns of stocks that currently trade on GB exchanges.
We aim to bring you long-term focused research analysis driven by fundamental data. Note that our analysis may not factor in the latest price-sensitive company announcements or qualitative material.
If you spot an error that warrants correction, please contact the editor at editorial-team@simplywallst.com. This article by Simply Wall St is general in nature. It does not constitute a recommendation to buy or sell any stock, and does not take account of your objectives, or your financial situation. Simply Wall St has no position in the stocks mentioned. Thank you for reading.
