
 Yahoo Finance
 The Cigna Group's Dividend Analysis
Assessing The Sustainability and Growth of The Cigna Group's Dividends
The Cigna Group (NYSE:CI) recently announced a dividend of $1.23 per share, payable on 2023-12-21, with the ex-dividend date set for 2023-12-05. As investors look forward to this upcoming payment, the spotlight also shines on the company's dividend history, yield, and growth rates. Using the data from GuruFocus, let's look into The Cigna Group's dividend performance and assess its sustainability.
What Does The Cigna Group Do?
This Powerful Chart Made Peter Lynch 29% A Year For 13 Years
How to calculate the intrinsic value of a stock?
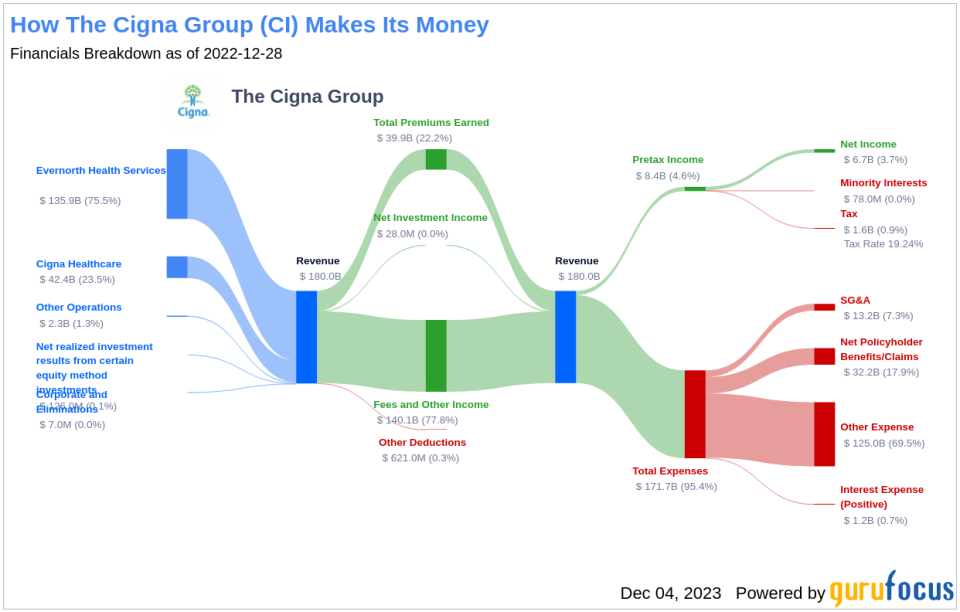
The Cigna Group primarily provides pharmacy benefit management and health insurance services. Its PBM services, which were greatly expanded by its 2018 merger with Express Scripts, are mostly sold to health insurance plans and employers. Its largest PBM contract is the Department of Defense and it recently won a deal with top-tier insurer Centene. In health insurance and other benefits, The Cigna Group mostly serves employers through self-funding arrangements, but it also operates in government programs, such as Medicare Advantage. The company operates mostly in the U.S. with 18 million U.S. medical members covered as of the end of June 2023.
A Glimpse at The Cigna Group's Dividend History
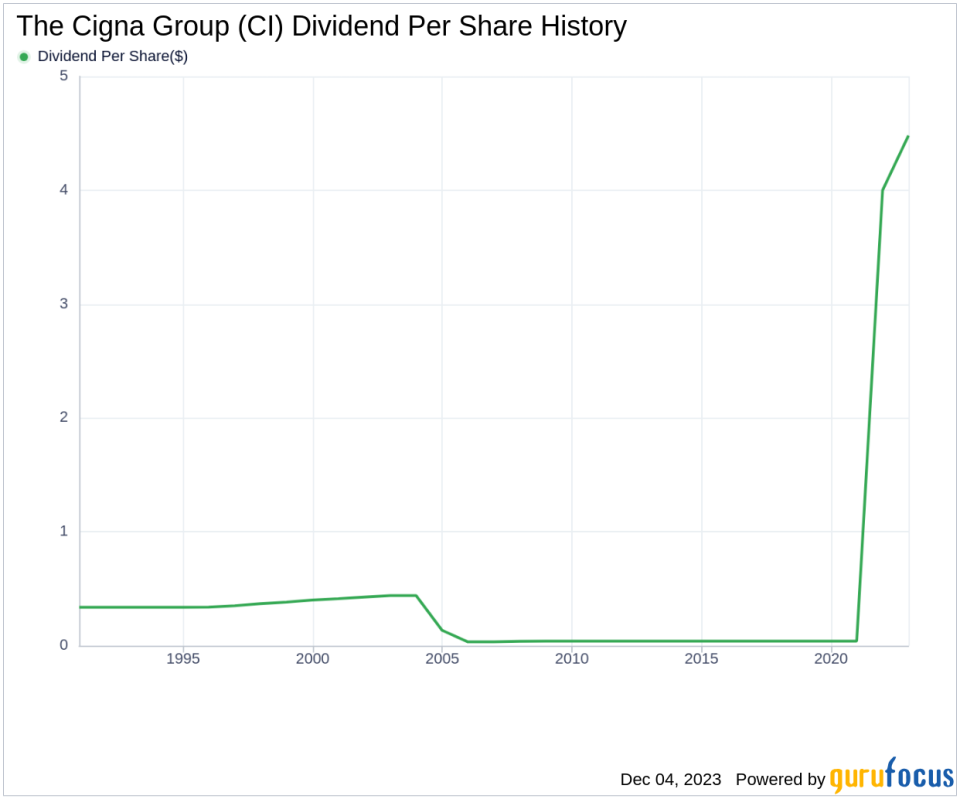
The Cigna Group has maintained a consistent dividend payment record since 1985. Dividends are currently distributed on a quarterly basis.
The Cigna Group has increased its dividend each year since 2005. The stock is thus listed as a dividend achiever, an honor that is given to companies that have increased their dividend each year for at least the past 18 years. Below is a chart showing annual Dividends Per Share for tracking historical trends.
Breaking Down The Cigna Group's Dividend Yield and Growth
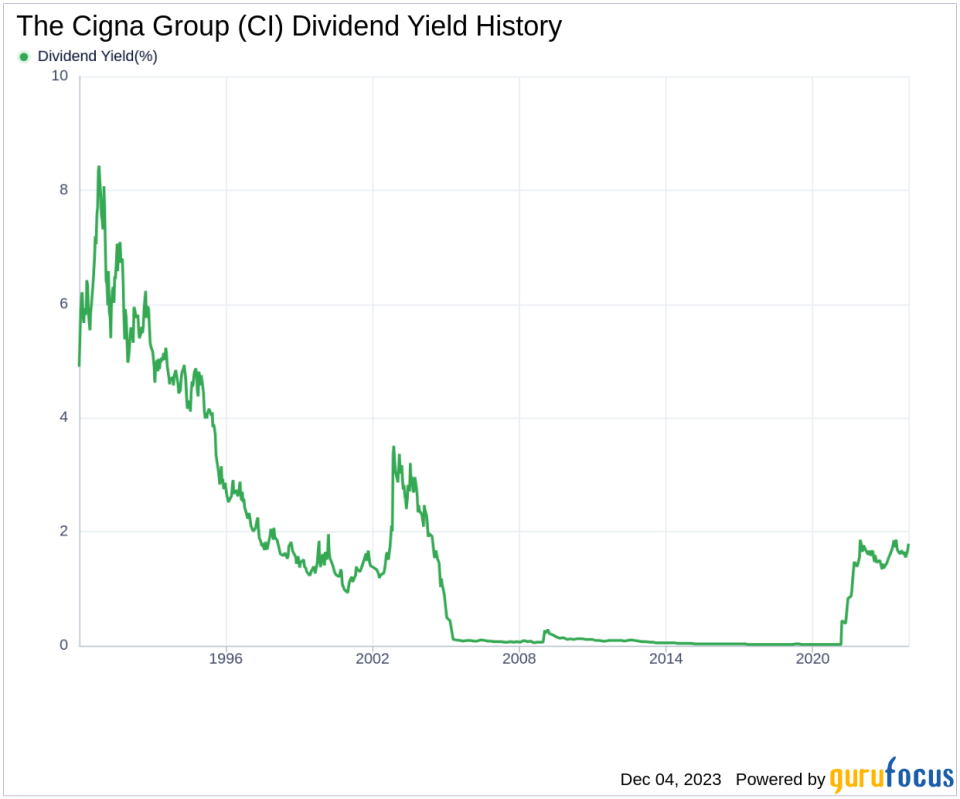
As of today, The Cigna Group currently has a 12-month trailing dividend yield of 1.79% and a 12-month forward dividend yield of 1.83%. This suggests an expectation of increased dividend payments over the next 12 months.
The Cigna Group's dividend yield of 1.79% is near a 10-year high and outperforms 42.86% of global competitors in the Healthcare Plans industry, suggesting that the company's dividend yield stands out as an attractive proposition for income investors.
Over the past three years, The Cigna Group's annual dividend growth rate was 382.00%. Extended to a five-year horizon, this rate decreased to 191.20% per year. And over the past decade, The Cigna Group's annual dividends per share growth rate stands at an impressive 46.50%.
Based on The Cigna Group's dividend yield and five-year growth rate, the 5-year yield on cost of The Cigna Group stock as of today is approximately 374.81%.
The Sustainability Question: Payout Ratio and Profitability
To assess the sustainability of the dividend, one needs to evaluate the company's payout ratio. The dividend payout ratio provides insights into the portion of earnings the company distributes as dividends. A lower ratio suggests that the company retains a significant part of its earnings, thereby ensuring the availability of funds for future growth and unexpected downturns. As of 2023-09-30, The Cigna Group's dividend payout ratio is 0.27.
The Cigna Group's profitability rank, offers an understanding of the company's earnings prowess relative to its peers. GuruFocus ranks The Cigna Group's profitability 7 out of 10 as of 2023-09-30, suggesting good profitability prospects. The company has reported positive net income for each of year over the past decade, further solidifying its high profitability.
Growth Metrics: The Future Outlook
To ensure the sustainability of dividends, a company must have robust growth metrics. The Cigna Group's growth rank of 7 out of 10 suggests that the company's growth trajectory is good relative to its competitors.
Revenue is the lifeblood of any company, and The Cigna Group's revenue per share, combined with the 3-year revenue growth rate, indicates a strong revenue model. The Cigna Group's revenue has increased by approximately 12.40% per year on average, a rate that underperforms approximately 50% of global competitors.
The company's 3-year EPS growth rate showcases its capability to grow its earnings, a critical component for sustaining dividends in the long run. During the past three years, The Cigna Group's earnings increased by approximately 10.90% per year on average, a rate that underperforms approximately 41.18% of global competitors.
Lastly, the company's 5-year EBITDA growth rate of 15.90%, which underperforms approximately 25% of global competitors.
Next Steps
In conclusion, The Cigna Group's consistent dividend payments, robust dividend growth rate, manageable payout ratio, and strong profitability indicators present a compelling case for income-focused investors. While some growth metrics suggest there are areas for improvement, the overall financial health of The Cigna Group appears to support the ongoing distribution and potential growth of dividends. Investors looking for stable dividend income may find The Cigna Group an attractive option to consider. However, as with any investment decision, it's crucial to conduct thorough research and consider the company's full financial picture before making a commitment.
GuruFocus Premium users can screen for high-dividend yield stocks using the High Dividend Yield Screener.
This article, generated by GuruFocus, is designed to provide general insights and is not tailored financial advice. Our commentary is rooted in historical data and analyst projections, utilizing an impartial methodology, and is not intended to serve as specific investment guidance. It does not formulate a recommendation to purchase or divest any stock and does not consider individual investment objectives or financial circumstances. Our objective is to deliver long-term, fundamental data-driven analysis. Be aware that our analysis might not incorporate the most recent, price-sensitive company announcements or qualitative information. GuruFocus holds no position in the stocks mentioned herein.
This article first appeared on GuruFocus.
