
 Yahoo Finance
 Cincinnati Financial (CINF) Q1 Earnings Top, Revenues Up Y/Y
Cincinnati Financial Corporation CINF reported first-quarter 2024 operating income of $1.72 per share, which beat the Zacks Consensus Estimate by 1.7%. The bottom line surged 93.2% year over year.
Total operating revenues in the quarter under review were $2.3 billion, which missed the Zacks Consensus Estimate by 1.4%. The top line, however, improved 8.8% year over year. This increase was driven by higher earned premiums and investment income.
The insurer’s results benefited from higher premiums, net investment income and improved combined ratio. Lower catastrophe losses and improved underwriting income in the property and casualty segment added to the upside.
Cincinnati Financial Corporation Price, Consensus and EPS Surprise
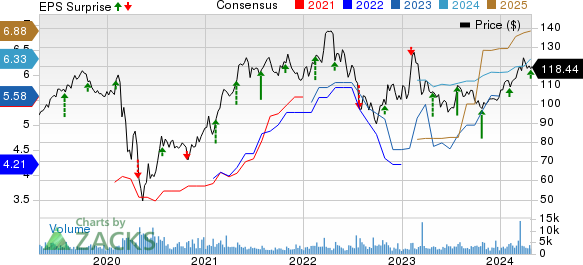
Cincinnati Financial Corporation price-consensus-eps-surprise-chart | Cincinnati Financial Corporation Quote
Operational Update
Net written premiums climbed 11% year over year to $2.2 billion, attributable largely to premium growth initiatives, price increases and a higher level of insured exposures.
Investment income, net of expenses, increased 17% year over year to $245 million, as bond interest grew 21% and dividends from the equity portfolio jumped 9%. The figure was higher than our estimate of $227.7 million.
Total benefits and expenses of Cincinnati Financial increased 0.4% year over year to $1.9 billion, primarily because of higher underwriting, acquisition and insurance expenses. The figure was lower than our estimate of $2 billion.
In its property & casualty insurance business, Cincinnati Financial recorded an underwriting income of $131 million against the year-ago loss of $10 million. The figure was higher than our estimate of $60.7 million underwriting income.
Combined ratio — a measure of underwriting profitability — improved 710 basis points (bps) year over year to 93.6%. Lower catastrophe losses contributed to the improvement.
Quarterly Segment Update
Commercial Lines Insurance: Total revenues of $1 billion increased 2% year over year. Our estimate and the Zacks Consensus Estimate were both pegged at $1.1 billion. The segment reported an underwriting income of $39 million against the year-ago loss of $2 million. The combined ratio improved 390 bps year over year to 96.5%.
Personal Lines Insurance: Total revenues of $589 million rose 27% year over year due to a 27% increase in premiums earned. Our estimate was $538.5 million, while the Zacks Consensus Estimate was pegged at $580 million. The segment reported an underwriting income of $37 million against the year-ago loss of $57 million. The combined ratio improved 1860 bps year over year to 93.9%.
Excess and Surplus Lines Insurance: Total revenues of $140 million grew 10% year over year, aided by 9% higher earned premiums. The metric missed the Zacks Consensus Estimate of $141 million and but was higher than our estimate of $120.7 million. The segment’s underwriting profit decreased 8% year over year to $18 million. The combined ratio deteriorated 200 bps to 91.9%.
Life Insurance: Total revenues were $125 million, flat year over year. The Zacks Consensus Estimate was pegged at $82 million. Our estimate was $80.4 million. Total benefits and expenses remained unchanged year over year at $101 million.
Financial Update
As of Mar 31, 2024, Cincinnati Financial had total assets worth $33.7 billion, which increased 2.9% from 2023-end. The total debt remained flat year over year at $815 million.
Cincinnati Financial’s debt-to-capital ratio was 6.1% as of Mar 31, 2024, which improved 20 bps from 2023-end.
As of Mar 31, 2024, its book value per share was a record high of $80.83, up 5% from 2023-end.
Zacks Rank
Cincinnati Financial currently carries a Zacks Rank #2 (Buy). You can see the complete list of today’s Zacks #1 Rank (Strong Buy) stocks here.
Performance of Other Property and Casualty Insurers
Chubb Limited CB reported first-quarter 2024 core operating income of $5.41 per share, which outpaced the Zacks Consensus Estimate by 2.3%. The bottom line increased 22.7% year over year. Net premiums written improved 14.1% year over year to $12.2 billion in the quarter. Our estimate was $11.4 billion, while the Zacks Consensus Estimate was pegged at $13 billion.
Net investment income was $1.4 billion, up 25.7% year over year. The Zacks Consensus Estimate was pegged at $1.3 billion, while our estimate for the same was $1.4 billion. Property and Casualty (P&C) underwriting income was $1.4 billion, up 16.7% year over year. Global P&C underwriting income, excluding Agriculture, was $1.3 billion, up 10.9%.
RLI Corp. RLI reported first-quarter 2024 operating earnings of $1.89 per share, beating the Zacks Consensus Estimate as well as the year-ago number by 16%. Operating revenues for the reported quarter were $394 million, up 17.6% year over year, driven by 17% higher net premiums earned and 21.3% higher net investment income. The top line, however, missed the Zacks Consensus Estimate by 0.1%.
Gross premiums written increased 13% year over year to $468 million. This uptick can be attributed to the solid performance of the Casualty (up 12.6%), Property (up 13.5%) and Surety segments (up 12.1%). Our estimate was $511 million. Underwriting income of $77.7 million increased 16%. Combined ratio deteriorated 60 bps year over year to 78.5. The Zacks Consensus Estimate for the metric was pegged at 85, while our estimate was 77.7.
W.R. Berkley Corporation’s WRB first-quarter 2024 operating income of $1.56 per share beat the Zacks Consensus Estimate of $1.46 by 6.9%. The bottom line improved 56% year over year. W.R. Berkley’s net premiums written were a record $2.9 billion, up 10.7% year over year. The figure was higher than our estimate of $2.8 billion. Operating revenues came in at $3.2 billion, up 11.6% year over year. The top line beat the consensus estimate by 0.2%.
Net investment income surged 43.2% to a record $319.8 million, driven by a 63.2% increase in the core portfolio. The figure was higher than our estimate of $302 million. Total expenses increased 6.5% to $2.7 billion. The figure matched our estimate. The loss ratio improved 160 bps)to 6.2, while the expense ratio improved 20 bps year over year to 28.6.
Want the latest recommendations from Zacks Investment Research? Today, you can download 7 Best Stocks for the Next 30 Days. Click to get this free report
RLI Corp. (RLI) : Free Stock Analysis Report
Chubb Limited (CB) : Free Stock Analysis Report
W.R. Berkley Corporation (WRB) : Free Stock Analysis Report
Cincinnati Financial Corporation (CINF) : Free Stock Analysis Report
