
 Yahoo Finance
 Was Cineworld Group plc’s (LON:CINE) Earnings Growth Better Than The Industry’s?

After looking at Cineworld Group plc’s (LON:CINE) latest earnings announcement (31 December 2017), I found it useful to revisit the company’s performance in the past couple of years and assess this against the most recent figures. As a long-term investor I tend to focus on earnings trend, rather than a single number at one point in time. Also, comparing it against an industry benchmark to understand whether it outperformed, or is simply riding an industry wave, is a crucial aspect. Below is a brief commentary on my key takeaways. See our latest analysis for Cineworld Group
How Well Did CINE Perform?
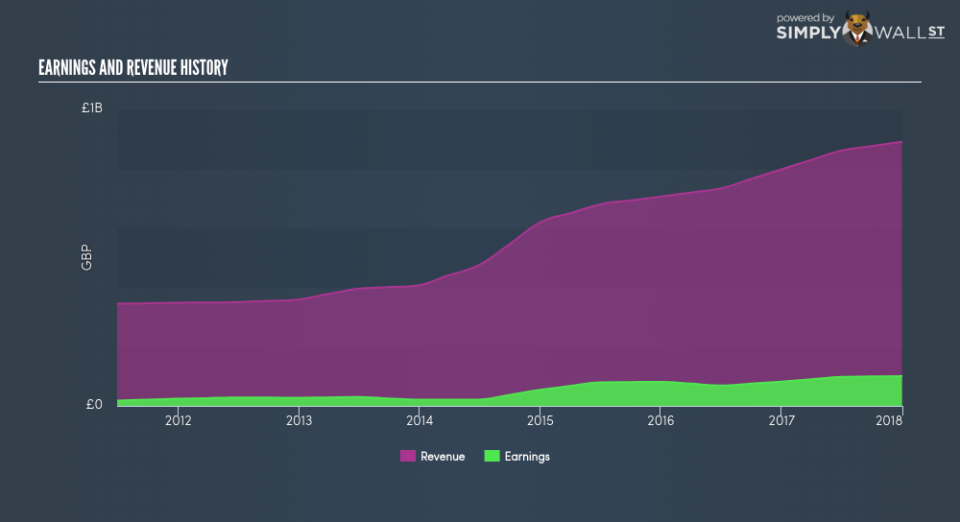
CINE’s trailing twelve-month earnings (from 31 December 2017) of UK£100.60m has jumped 22.68% compared to the previous year. However, this one-year growth rate has been lower than its average earnings growth rate over the past 5 years of 26.50%, indicating the rate at which CINE is growing has slowed down. To understand what’s happening, let’s take a look at what’s going on with margins and if the rest of the industry is facing the same headwind.
Over the last couple of years, revenue growth has not been able to catch up, which implies that Cineworld Group’s bottom line has been propelled by unsustainable cost-reductions. Scanning growth from a sector-level, the UK media industry has been growing its average earnings by double-digit 30.40% over the past twelve months, and a more muted 8.67% over the last five years. This suggests that whatever tailwind the industry is profiting from, Cineworld Group has not been able to leverage it as much as its average peer.
In terms of returns from investment, Cineworld Group has not invested its equity funds well, leading to a 12.97% return on equity (ROE), below the sensible minimum of 20%. However, its return on assets (ROA) of 7.65% exceeds the GB Media industry of 5.12%, indicating Cineworld Group has used its assets more efficiently. And finally, its return on capital (ROC), which also accounts for Cineworld Group’s debt level, has increased over the past 3 years from 8.61% to 9.86%. This correlates with a decrease in debt holding, with debt-to-equity ratio declining from 72.61% to 44.61% over the past 5 years.
What does this mean?
Cineworld Group’s track record can be a valuable insight into its earnings performance, but it certainly doesn’t tell the whole story. While Cineworld Group has a good historical track record with positive growth and profitability, there’s no certainty that this will extrapolate into the future. I suggest you continue to research Cineworld Group to get a more holistic view of the stock by looking at:
Future Outlook: What are well-informed industry analysts predicting for CINE’s future growth? Take a look at our free research report of analyst consensus for CINE’s outlook.
Financial Health: Is CINE’s operations financially sustainable? Balance sheets can be hard to analyze, which is why we’ve done it for you. Check out our financial health checks here.
Other High-Performing Stocks: Are there other stocks that provide better prospects with proven track records? Explore our free list of these great stocks here.
NB: Figures in this article are calculated using data from the trailing twelve months from 31 December 2017. This may not be consistent with full year annual report figures.
To help readers see pass the short term volatility of the financial market, we aim to bring you a long-term focused research analysis purely driven by fundamental data. Note that our analysis does not factor in the latest price sensitive company announcements.
The author is an independent contributor and at the time of publication had no position in the stocks mentioned.
