
 Yahoo Finance
 Clean Harbors' (NYSE:CLH) five-year earnings growth trails the strong shareholder returns
The worst result, after buying shares in a company (assuming no leverage), would be if you lose all the money you put in. But on the bright side, you can make far more than 100% on a really good stock. One great example is Clean Harbors, Inc. (NYSE:CLH) which saw its share price drive 209% higher over five years. It's also good to see the share price up 18% over the last quarter. This could be related to the recent financial results, released recently - you can catch up on the most recent data by reading our company report.
Since the stock has added US$419m to its market cap in the past week alone, let's see if underlying performance has been driving long-term returns.
Check out our latest analysis for Clean Harbors
To quote Buffett, 'Ships will sail around the world but the Flat Earth Society will flourish. There will continue to be wide discrepancies between price and value in the marketplace...' One imperfect but simple way to consider how the market perception of a company has shifted is to compare the change in the earnings per share (EPS) with the share price movement.
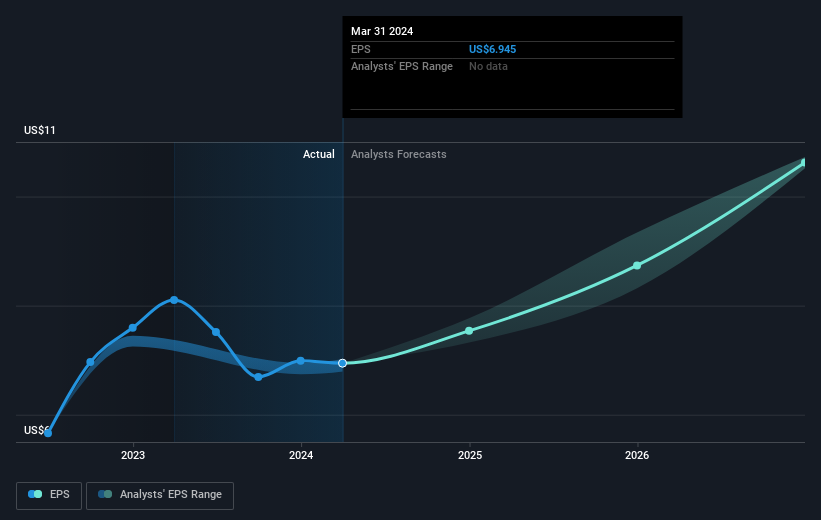
Over half a decade, Clean Harbors managed to grow its earnings per share at 38% a year. This EPS growth is higher than the 25% average annual increase in the share price. So it seems the market isn't so enthusiastic about the stock these days.
You can see below how EPS has changed over time (discover the exact values by clicking on the image).
It's probably worth noting that the CEO is paid less than the median at similar sized companies. But while CEO remuneration is always worth checking, the really important question is whether the company can grow earnings going forward. Dive deeper into the earnings by checking this interactive graph of Clean Harbors' earnings, revenue and cash flow.
A Different Perspective
It's nice to see that Clean Harbors shareholders have received a total shareholder return of 51% over the last year. That's better than the annualised return of 25% over half a decade, implying that the company is doing better recently. Given the share price momentum remains strong, it might be worth taking a closer look at the stock, lest you miss an opportunity. I find it very interesting to look at share price over the long term as a proxy for business performance. But to truly gain insight, we need to consider other information, too. Consider for instance, the ever-present spectre of investment risk. We've identified 2 warning signs with Clean Harbors , and understanding them should be part of your investment process.
Of course Clean Harbors may not be the best stock to buy. So you may wish to see this free collection of growth stocks.
Please note, the market returns quoted in this article reflect the market weighted average returns of stocks that currently trade on American exchanges.
Have feedback on this article? Concerned about the content? Get in touch with us directly. Alternatively, email editorial-team (at) simplywallst.com.
This article by Simply Wall St is general in nature. We provide commentary based on historical data and analyst forecasts only using an unbiased methodology and our articles are not intended to be financial advice. It does not constitute a recommendation to buy or sell any stock, and does not take account of your objectives, or your financial situation. We aim to bring you long-term focused analysis driven by fundamental data. Note that our analysis may not factor in the latest price-sensitive company announcements or qualitative material. Simply Wall St has no position in any stocks mentioned.
