
 Yahoo Finance
 Clearfield (NASDAQ:CLFD) Knows How To Allocate Capital Effectively
Did you know there are some financial metrics that can provide clues of a potential multi-bagger? Amongst other things, we'll want to see two things; firstly, a growing return on capital employed (ROCE) and secondly, an expansion in the company's amount of capital employed. Ultimately, this demonstrates that it's a business that is reinvesting profits at increasing rates of return. So when we looked at the ROCE trend of Clearfield (NASDAQ:CLFD) we really liked what we saw.
Return On Capital Employed (ROCE): What is it?
If you haven't worked with ROCE before, it measures the 'return' (pre-tax profit) a company generates from capital employed in its business. To calculate this metric for Clearfield, this is the formula:
Return on Capital Employed = Earnings Before Interest and Tax (EBIT) ÷ (Total Assets - Current Liabilities)
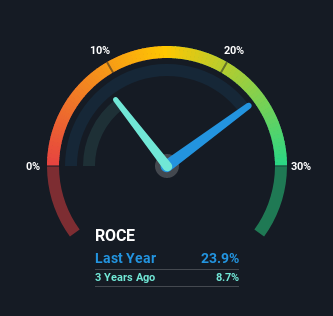
0.24 = US$25m ÷ (US$126m - US$20m) (Based on the trailing twelve months to September 2021).
So, Clearfield has an ROCE of 24%. In absolute terms that's a great return and it's even better than the Communications industry average of 7.1%.
Check out our latest analysis for Clearfield
In the above chart we have measured Clearfield's prior ROCE against its prior performance, but the future is arguably more important. If you'd like to see what analysts are forecasting going forward, you should check out our free report for Clearfield.
What Does the ROCE Trend For Clearfield Tell Us?
We like the trends that we're seeing from Clearfield. The numbers show that in the last five years, the returns generated on capital employed have grown considerably to 24%. Basically the business is earning more per dollar of capital invested and in addition to that, 67% more capital is being employed now too. The increasing returns on a growing amount of capital is common amongst multi-baggers and that's why we're impressed.
In Conclusion...
A company that is growing its returns on capital and can consistently reinvest in itself is a highly sought after trait, and that's what Clearfield has. And with the stock having performed exceptionally well over the last five years, these patterns are being accounted for by investors. In light of that, we think it's worth looking further into this stock because if Clearfield can keep these trends up, it could have a bright future ahead.
If you want to continue researching Clearfield, you might be interested to know about the 2 warning signs that our analysis has discovered.
If you'd like to see other companies earning high returns, check out our free list of companies earning high returns with solid balance sheets here.
Have feedback on this article? Concerned about the content? Get in touch with us directly. Alternatively, email editorial-team (at) simplywallst.com.
This article by Simply Wall St is general in nature. We provide commentary based on historical data and analyst forecasts only using an unbiased methodology and our articles are not intended to be financial advice. It does not constitute a recommendation to buy or sell any stock, and does not take account of your objectives, or your financial situation. We aim to bring you long-term focused analysis driven by fundamental data. Note that our analysis may not factor in the latest price-sensitive company announcements or qualitative material. Simply Wall St has no position in any stocks mentioned.
