
 Yahoo Finance
 Is Clinigen Group (LON:CLIN) Using Too Much Debt?

Legendary fund manager Li Lu (who Charlie Munger backed) once said, 'The biggest investment risk is not the volatility of prices, but whether you will suffer a permanent loss of capital.' It's only natural to consider a company's balance sheet when you examine how risky it is, since debt is often involved when a business collapses. We can see that Clinigen Group Plc (LON:CLIN) does use debt in its business. But the more important question is: how much risk is that debt creating?
Why Does Debt Bring Risk?
Debt and other liabilities become risky for a business when it cannot easily fulfill those obligations, either with free cash flow or by raising capital at an attractive price. If things get really bad, the lenders can take control of the business. However, a more frequent (but still costly) occurrence is where a company must issue shares at bargain-basement prices, permanently diluting shareholders, just to shore up its balance sheet. Of course, the upside of debt is that it often represents cheap capital, especially when it replaces dilution in a company with the ability to reinvest at high rates of return. When we examine debt levels, we first consider both cash and debt levels, together.
See our latest analysis for Clinigen Group
What Is Clinigen Group's Net Debt?
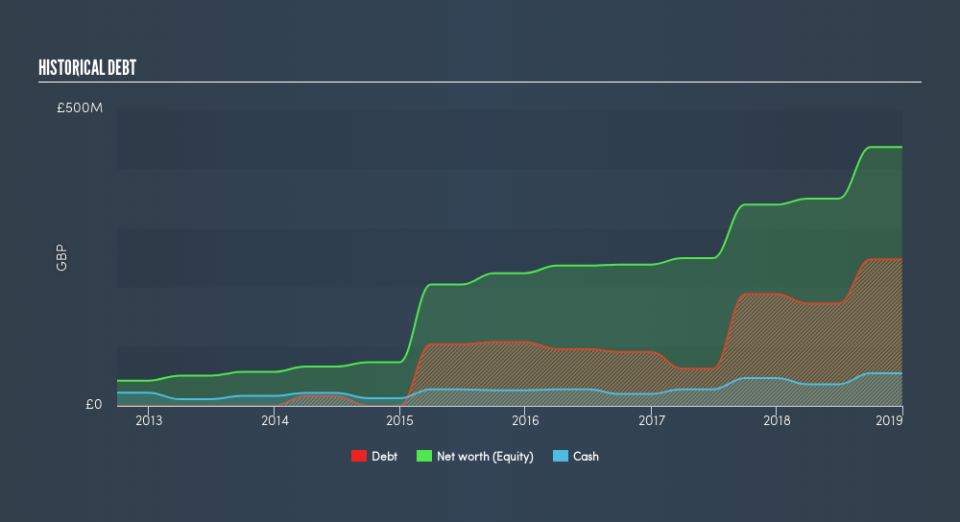
You can click the graphic below for the historical numbers, but it shows that as of December 2018 Clinigen Group had UK£247.3m of debt, an increase on UK£188.7m, over one year. However, it also had UK£55.1m in cash, and so its net debt is UK£192.2m.
How Strong Is Clinigen Group's Balance Sheet?
We can see from the most recent balance sheet that Clinigen Group had liabilities of UK£115.2m falling due within a year, and liabilities of UK£329.9m due beyond that. On the other hand, it had cash of UK£55.1m and UK£96.7m worth of receivables due within a year. So its liabilities outweigh the sum of its cash and (near-term) receivables by UK£293.3m.
Clinigen Group has a market capitalization of UK£1.16b, so it could very likely raise cash to ameliorate its balance sheet, if the need arose. However, it is still worthwhile taking a close look at its ability to pay off debt.
We measure a company's debt load relative to its earnings power by looking at its net debt divided by its earnings before interest, tax, depreciation, and amortization (EBITDA) and by calculating how easily its earnings before interest and tax (EBIT) cover its interest expense (interest cover). Thus we consider debt relative to earnings both with and without depreciation and amortization expenses.
Clinigen Group's net debt of 2.3 times EBITDA suggests graceful use of debt. And the fact that its trailing twelve months of EBIT was 7.6 times its interest expenses harmonizes with that theme. One way Clinigen Group could vanquish its debt would be if it stops borrowing more but conitinues to grow EBIT at around 10%, as it did over the last year. The balance sheet is clearly the area to focus on when you are analysing debt. But ultimately the future profitability of the business will decide if Clinigen Group can strengthen its balance sheet over time. So if you're focused on the future you can check out this free report showing analyst profit forecasts.
But our final consideration is also important, because a company cannot pay debt with paper profits; it needs cold hard cash. So we always check how much of that EBIT is translated into free cash flow. Over the most recent three years, Clinigen Group recorded free cash flow worth 77% of its EBIT, which is around normal, given free cash flow excludes interest and tax. This free cash flow puts the company in a good position to pay down debt, when appropriate.
Our View
Happily, Clinigen Group's impressive conversion of EBIT to free cash flow implies it has the upper hand on its debt. And we also thought its interest cover was a positive. Taking all this data into account, it seems to us that Clinigen Group takes a pretty sensible approach to debt. While that brings some risk, it can also enhance returns for shareholders. Of course, we wouldn't say no to the extra confidence that we'd gain if we knew that Clinigen Group insiders have been buying shares: if you're on the same wavelength, you can find out if insiders are buying by clicking this link.
Of course, if you're the type of investor who prefers buying stocks without the burden of debt, then don't hesitate to discover our exclusive list of net cash growth stocks, today.
We aim to bring you long-term focused research analysis driven by fundamental data. Note that our analysis may not factor in the latest price-sensitive company announcements or qualitative material.
If you spot an error that warrants correction, please contact the editor at editorial-team@simplywallst.com. This article by Simply Wall St is general in nature. It does not constitute a recommendation to buy or sell any stock, and does not take account of your objectives, or your financial situation. Simply Wall St has no position in the stocks mentioned. Thank you for reading.
