
 Yahoo Finance
 Is Cloetta AB (publ)'s (STO:CLA B) 4.5% Dividend Worth Your Time?

Could Cloetta AB (publ) (STO:CLA B) be an attractive dividend share to own for the long haul? Investors are often drawn to strong companies with the idea of reinvesting the dividends. If you are hoping to live on your dividends, it's important to be more stringent with your investments than the average punter. Regular readers know we like to apply the same approach to each dividend stock, and we hope you'll find our analysis useful.
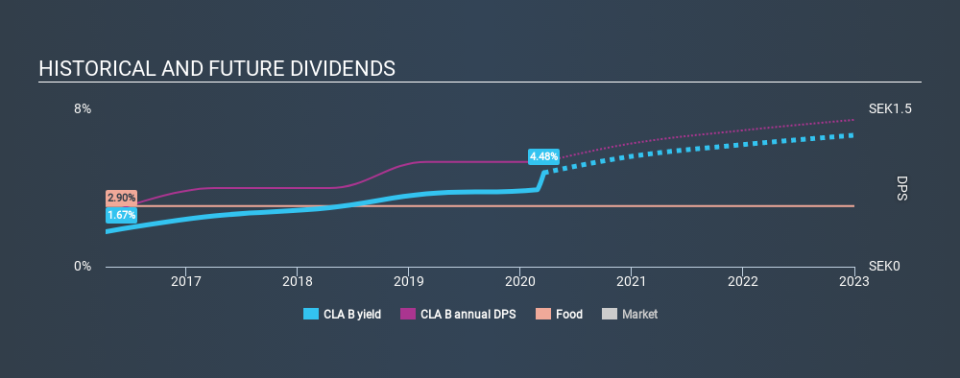
With a four-year payment history and a 4.5% yield, many investors probably find Cloetta intriguing. We'd agree the yield does look enticing. Some simple research can reduce the risk of buying Cloetta for its dividend - read on to learn more.
Explore this interactive chart for our latest analysis on Cloetta!
Payout ratios
Dividends are usually paid out of company earnings. If a company is paying more than it earns, then the dividend might become unsustainable - hardly an ideal situation. As a result, we should always investigate whether a company can afford its dividend, measured as a percentage of a company's net income after tax. Cloetta paid out 58% of its profit as dividends, over the trailing twelve month period. This is a healthy payout ratio, and while it does limit the amount of earnings that can be reinvested in the business, there is also some room to lift the payout ratio over time.
Another important check we do is to see if the free cash flow generated is sufficient to pay the dividend. Cloetta paid out 53% of its free cash flow last year, which is acceptable, but is starting to limit the amount of earnings that can be reinvested into the business. It's positive to see that Cloetta's dividend is covered by both profits and cash flow, since this is generally a sign that the dividend is sustainable, and a lower payout ratio usually suggests a greater margin of safety before the dividend gets cut.
Is Cloetta's Balance Sheet Risky?
As Cloetta has a meaningful amount of debt, we need to check its balance sheet to see if the company might have debt risks. A quick check of its financial situation can be done with two ratios: net debt divided by EBITDA (earnings before interest, tax, depreciation and amortisation), and net interest cover. Net debt to EBITDA is a measure of a company's total debt. Net interest cover measures the ability to meet interest payments. Essentially we check that a) the company does not have too much debt, and b) that it can afford to pay the interest. With net debt of 2.26 times its EBITDA, Cloetta has a noticeable amount of debt, although if business stays steady, this may not be overly concerning.
Net interest cover can be calculated by dividing earnings before interest and tax (EBIT) by the company's net interest expense. Cloetta has interest cover of more than 12 times its interest expense, which we think is quite strong.
Remember, you can always get a snapshot of Cloetta's latest financial position, by checking our visualisation of its financial health.
Dividend Volatility
Before buying a stock for its income, we want to see if the dividends have been stable in the past, and if the company has a track record of maintaining its dividend. Cloetta has been paying a dividend for the past four years. The company has been paying a stable dividend for a few years now, but we'd like to see more evidence of consistency over a longer period. During the past four-year period, the first annual payment was kr0.50 in 2016, compared to kr1.00 last year. Dividends per share have grown at approximately 19% per year over this time.
Cloetta has been growing its dividend quite rapidly, which is exciting. However, the short payment history makes us question whether this performance will persist across a full market cycle.
Dividend Growth Potential
Dividend payments have been consistent over the past few years, but we should always check if earnings per share (EPS) are growing, as this will help maintain the purchasing power of the dividend. Strong earnings per share (EPS) growth might encourage our interest in the company despite fluctuating dividends, which is why it's great to see Cloetta has grown its earnings per share at 16% per annum over the past five years. Earnings per share have been growing rapidly, but given that it is paying out more than half of its earnings as dividends, we wonder how Cloetta will keep funding its growth projects in the future.
Conclusion
Dividend investors should always want to know if a) a company's dividends are affordable, b) if there is a track record of consistent payments, and c) if the dividend is capable of growing. First, we think Cloetta is paying out an acceptable percentage of its cashflow and profit. Next, earnings growth has been good, but unfortunately the company has not been paying dividends as long as we'd like. While we're not hugely bearish on it, overall we think there are potentially better dividend stocks than Cloetta out there.
Market movements attest to how highly valued a consistent dividend policy is to one to which is more unpredictable. However, there are other things to consider for investors when analysing stock performance. For instance, we've picked out 3 warning signs for Cloetta that investors should take into consideration.
We have also put together a list of global stocks with a market capitalisation above $1bn and yielding more 3%.
If you spot an error that warrants correction, please contact the editor at editorial-team@simplywallst.com. This article by Simply Wall St is general in nature. It does not constitute a recommendation to buy or sell any stock, and does not take account of your objectives, or your financial situation. Simply Wall St has no position in the stocks mentioned.
We aim to bring you long-term focused research analysis driven by fundamental data. Note that our analysis may not factor in the latest price-sensitive company announcements or qualitative material. Thank you for reading.
