
 Yahoo Finance
 Clorox's (NYSE:CLX) Returns On Capital Not Reflecting Well On The Business
When it comes to investing, there are some useful financial metrics that can warn us when a business is potentially in trouble. Businesses in decline often have two underlying trends, firstly, a declining return on capital employed (ROCE) and a declining base of capital employed. This reveals that the company isn't compounding shareholder wealth because returns are falling and its net asset base is shrinking. On that note, looking into Clorox (NYSE:CLX), we weren't too upbeat about how things were going.
Understanding Return On Capital Employed (ROCE)
If you haven't worked with ROCE before, it measures the 'return' (pre-tax profit) a company generates from capital employed in its business. Analysts use this formula to calculate it for Clorox:
Return on Capital Employed = Earnings Before Interest and Tax (EBIT) ÷ (Total Assets - Current Liabilities)
0.22 = US$852m ÷ (US$5.9b - US$2.0b) (Based on the trailing twelve months to December 2023).
So, Clorox has an ROCE of 22%. On its own, that's a very good return and it's on par with the returns earned by companies in a similar industry.
View our latest analysis for Clorox
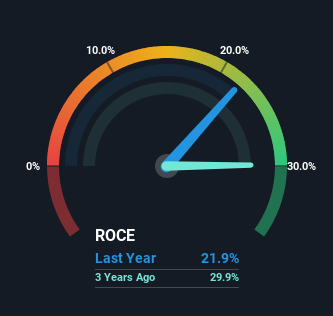
In the above chart we have measured Clorox's prior ROCE against its prior performance, but the future is arguably more important. If you'd like, you can check out the forecasts from the analysts covering Clorox for free.
What Does the ROCE Trend For Clorox Tell Us?
In terms of Clorox's historical ROCE movements, the trend doesn't inspire confidence. Unfortunately the returns on capital have diminished from the 29% that they were earning five years ago. Meanwhile, capital employed in the business has stayed roughly the flat over the period. This combination can be indicative of a mature business that still has areas to deploy capital, but the returns received aren't as high due potentially to new competition or smaller margins. So because these trends aren't typically conducive to creating a multi-bagger, we wouldn't hold our breath on Clorox becoming one if things continue as they have.
On a side note, Clorox's current liabilities have increased over the last five years to 34% of total assets, effectively distorting the ROCE to some degree. Without this increase, it's likely that ROCE would be even lower than 22%. Keep an eye on this ratio, because the business could encounter some new risks if this metric gets too high.
Our Take On Clorox's ROCE
In the end, the trend of lower returns on the same amount of capital isn't typically an indication that we're looking at a growth stock. In spite of that, the stock has delivered a 4.5% return to shareholders who held over the last five years. Either way, we aren't huge fans of the current trends and so with that we think you might find better investments elsewhere.
If you want to continue researching Clorox, you might be interested to know about the 4 warning signs that our analysis has discovered.
If you'd like to see other companies earning high returns, check out our free list of companies earning high returns with solid balance sheets here.
Have feedback on this article? Concerned about the content? Get in touch with us directly. Alternatively, email editorial-team (at) simplywallst.com.
This article by Simply Wall St is general in nature. We provide commentary based on historical data and analyst forecasts only using an unbiased methodology and our articles are not intended to be financial advice. It does not constitute a recommendation to buy or sell any stock, and does not take account of your objectives, or your financial situation. We aim to bring you long-term focused analysis driven by fundamental data. Note that our analysis may not factor in the latest price-sensitive company announcements or qualitative material. Simply Wall St has no position in any stocks mentioned.
