
 Yahoo Finance
 A Close Look At Arcontech Group plc’s (LON:ARC) 18% ROCE

Today we'll look at Arcontech Group plc (LON:ARC) and reflect on its potential as an investment. Specifically, we're going to calculate its Return On Capital Employed (ROCE), in the hopes of getting some insight into the business.
First, we'll go over how we calculate ROCE. Next, we'll compare it to others in its industry. Then we'll determine how its current liabilities are affecting its ROCE.
What is Return On Capital Employed (ROCE)?
ROCE is a metric for evaluating how much pre-tax income (in percentage terms) a company earns on the capital invested in its business. Generally speaking a higher ROCE is better. Ultimately, it is a useful but imperfect metric. Renowned investment researcher Michael Mauboussin has suggested that a high ROCE can indicate that 'one dollar invested in the company generates value of more than one dollar'.
So, How Do We Calculate ROCE?
The formula for calculating the return on capital employed is:
Return on Capital Employed = Earnings Before Interest and Tax (EBIT) ÷ (Total Assets - Current Liabilities)
Or for Arcontech Group:
0.18 = UK£1.0m ÷ (UK£6.5m - UK£682k) (Based on the trailing twelve months to June 2019.)
So, Arcontech Group has an ROCE of 18%.
Check out our latest analysis for Arcontech Group
Does Arcontech Group Have A Good ROCE?
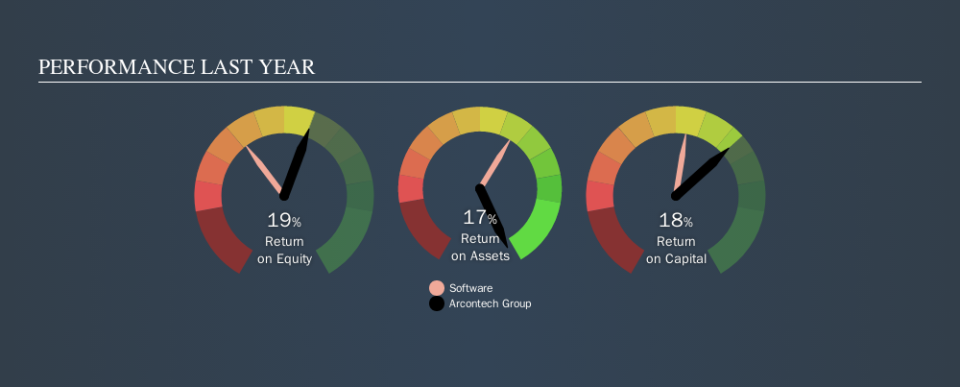
ROCE is commonly used for comparing the performance of similar businesses. In our analysis, Arcontech Group's ROCE is meaningfully higher than the 9.5% average in the Software industry. We consider this a positive sign, because it suggests it uses capital more efficiently than similar companies. Independently of how Arcontech Group compares to its industry, its ROCE in absolute terms appears decent, and the company may be worthy of closer investigation.
We can see that, Arcontech Group currently has an ROCE of 18% compared to its ROCE 3 years ago, which was 13%. This makes us wonder if the company is improving. The image below shows how Arcontech Group's ROCE compares to its industry, and you can click it to see more detail on its past growth.
When considering ROCE, bear in mind that it reflects the past and does not necessarily predict the future. Companies in cyclical industries can be difficult to understand using ROCE, as returns typically look high during boom times, and low during busts. This is because ROCE only looks at one year, instead of considering returns across a whole cycle. What happens in the future is pretty important for investors, so we have prepared a free report on analyst forecasts for Arcontech Group.
What Are Current Liabilities, And How Do They Affect Arcontech Group's ROCE?
Current liabilities are short term bills and invoices that need to be paid in 12 months or less. Due to the way ROCE is calculated, a high level of current liabilities makes a company look as though it has less capital employed, and thus can (sometimes unfairly) boost the ROCE. To counter this, investors can check if a company has high current liabilities relative to total assets.
Arcontech Group has total assets of UK£6.5m and current liabilities of UK£682k. Therefore its current liabilities are equivalent to approximately 11% of its total assets. A fairly low level of current liabilities is not influencing the ROCE too much.
The Bottom Line On Arcontech Group's ROCE
This is good to see, and with a sound ROCE, Arcontech Group could be worth a closer look. Arcontech Group looks strong on this analysis, but there are plenty of other companies that could be a good opportunity . Here is a free list of companies growing earnings rapidly.
For those who like to find winning investments this free list of growing companies with recent insider purchasing, could be just the ticket.
We aim to bring you long-term focused research analysis driven by fundamental data. Note that our analysis may not factor in the latest price-sensitive company announcements or qualitative material.
If you spot an error that warrants correction, please contact the editor at editorial-team@simplywallst.com. This article by Simply Wall St is general in nature. It does not constitute a recommendation to buy or sell any stock, and does not take account of your objectives, or your financial situation. Simply Wall St has no position in the stocks mentioned. Thank you for reading.
