
 Yahoo Finance
 A Closer Look At Ackroo Inc.'s (CVE:AKR) Impressive ROE
One of the best investments we can make is in our own knowledge and skill set. With that in mind, this article will work through how we can use Return On Equity (ROE) to better understand a business. We'll use ROE to examine Ackroo Inc. (CVE:AKR), by way of a worked example.
Return on equity or ROE is a key measure used to assess how efficiently a company's management is utilizing the company's capital. Put another way, it reveals the company's success at turning shareholder investments into profits.
Check out our latest analysis for Ackroo
How Do You Calculate Return On Equity?
The formula for return on equity is:
Return on Equity = Net Profit (from continuing operations) ÷ Shareholders' Equity
So, based on the above formula, the ROE for Ackroo is:
26% = CA$497k ÷ CA$1.9m (Based on the trailing twelve months to September 2023).
The 'return' is the income the business earned over the last year. One way to conceptualize this is that for each CA$1 of shareholders' capital it has, the company made CA$0.26 in profit.
Does Ackroo Have A Good ROE?
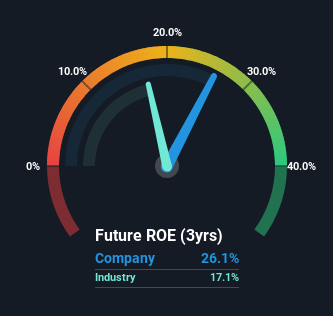
By comparing a company's ROE with its industry average, we can get a quick measure of how good it is. However, this method is only useful as a rough check, because companies do differ quite a bit within the same industry classification. As you can see in the graphic below, Ackroo has a higher ROE than the average (17%) in the Software industry.
That's clearly a positive. Bear in mind, a high ROE doesn't always mean superior financial performance. Aside from changes in net income, a high ROE can also be the outcome of high debt relative to equity, which indicates risk. You can see the 5 risks we have identified for Ackroo by visiting our risks dashboard for free on our platform here.
How Does Debt Impact ROE?
Virtually all companies need money to invest in the business, to grow profits. That cash can come from retained earnings, issuing new shares (equity), or debt. In the first and second cases, the ROE will reflect this use of cash for investment in the business. In the latter case, the use of debt will improve the returns, but will not change the equity. That will make the ROE look better than if no debt was used.
Combining Ackroo's Debt And Its 26% Return On Equity
Ackroo clearly uses a high amount of debt to boost returns, as it has a debt to equity ratio of 1.57. There's no doubt the ROE is impressive, but it's worth keeping in mind that the metric could have been lower if the company were to reduce its debt. Debt does bring extra risk, so it's only really worthwhile when a company generates some decent returns from it.
Conclusion
Return on equity is a useful indicator of the ability of a business to generate profits and return them to shareholders. Companies that can achieve high returns on equity without too much debt are generally of good quality. If two companies have around the same level of debt to equity, and one has a higher ROE, I'd generally prefer the one with higher ROE.
But ROE is just one piece of a bigger puzzle, since high quality businesses often trade on high multiples of earnings. It is important to consider other factors, such as future profit growth -- and how much investment is required going forward. Check the past profit growth by Ackroo by looking at this visualization of past earnings, revenue and cash flow.
Of course, you might find a fantastic investment by looking elsewhere. So take a peek at this free list of interesting companies.
Have feedback on this article? Concerned about the content? Get in touch with us directly. Alternatively, email editorial-team (at) simplywallst.com.
This article by Simply Wall St is general in nature. We provide commentary based on historical data and analyst forecasts only using an unbiased methodology and our articles are not intended to be financial advice. It does not constitute a recommendation to buy or sell any stock, and does not take account of your objectives, or your financial situation. We aim to bring you long-term focused analysis driven by fundamental data. Note that our analysis may not factor in the latest price-sensitive company announcements or qualitative material. Simply Wall St has no position in any stocks mentioned.
