
 Yahoo Finance
 A Closer Look At Unilever PLC's (LON:ULVR) Impressive ROE
Many investors are still learning about the various metrics that can be useful when analysing a stock. This article is for those who would like to learn about Return On Equity (ROE). By way of learning-by-doing, we'll look at ROE to gain a better understanding of Unilever PLC (LON:ULVR).
ROE or return on equity is a useful tool to assess how effectively a company can generate returns on the investment it received from its shareholders. In short, ROE shows the profit each dollar generates with respect to its shareholder investments.
Check out our latest analysis for Unilever
How Is ROE Calculated?
The formula for return on equity is:
Return on Equity = Net Profit (from continuing operations) ÷ Shareholders' Equity
So, based on the above formula, the ROE for Unilever is:
35% = UK£6.4b ÷ UK£18b (Based on the trailing twelve months to December 2020).
The 'return' refers to a company's earnings over the last year. Another way to think of that is that for every £1 worth of equity, the company was able to earn £0.35 in profit.
Does Unilever Have A Good ROE?
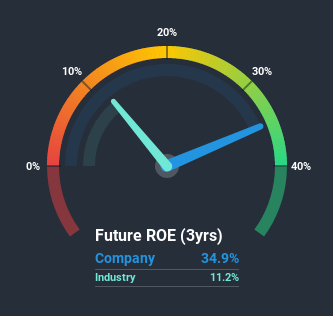
Arguably the easiest way to assess company's ROE is to compare it with the average in its industry. However, this method is only useful as a rough check, because companies do differ quite a bit within the same industry classification. Pleasingly, Unilever has a superior ROE than the average (11%) in the Personal Products industry.
That's clearly a positive. Bear in mind, a high ROE doesn't always mean superior financial performance. Aside from changes in net income, a high ROE can also be the outcome of high debt relative to equity, which indicates risk. Our risks dashboardshould have the 2 risks we have identified for Unilever.
The Importance Of Debt To Return On Equity
Companies usually need to invest money to grow their profits. That cash can come from issuing shares, retained earnings, or debt. In the first and second cases, the ROE will reflect this use of cash for investment in the business. In the latter case, the debt required for growth will boost returns, but will not impact the shareholders' equity. Thus the use of debt can improve ROE, albeit along with extra risk in the case of stormy weather, metaphorically speaking.
Unilever's Debt And Its 35% ROE
Unilever does use a high amount of debt to increase returns. It has a debt to equity ratio of 1.46. There's no doubt the ROE is impressive, but it's worth keeping in mind that the metric could have been lower if the company were to reduce its debt. Debt does bring extra risk, so it's only really worthwhile when a company generates some decent returns from it.
Summary
Return on equity is one way we can compare its business quality of different companies. A company that can achieve a high return on equity without debt could be considered a high quality business. All else being equal, a higher ROE is better.
But ROE is just one piece of a bigger puzzle, since high quality businesses often trade on high multiples of earnings. The rate at which profits are likely to grow, relative to the expectations of profit growth reflected in the current price, must be considered, too. So you might want to take a peek at this data-rich interactive graph of forecasts for the company.
Of course Unilever may not be the best stock to buy. So you may wish to see this free collection of other companies that have high ROE and low debt.
This article by Simply Wall St is general in nature. It does not constitute a recommendation to buy or sell any stock, and does not take account of your objectives, or your financial situation. We aim to bring you long-term focused analysis driven by fundamental data. Note that our analysis may not factor in the latest price-sensitive company announcements or qualitative material. Simply Wall St has no position in any stocks mentioned.
Have feedback on this article? Concerned about the content? Get in touch with us directly. Alternatively, email editorial-team (at) simplywallst.com.
