
 Yahoo Finance
 CMO Group PLC (LON:CMO) Stock Is Going Strong But Fundamentals Look Uncertain: What Lies Ahead ?
Most readers would already be aware that CMO Group's (LON:CMO) stock increased significantly by 30% over the past three months. However, we decided to pay attention to the company's fundamentals which don't appear to give a clear sign about the company's financial health. Specifically, we decided to study CMO Group's ROE in this article.
ROE or return on equity is a useful tool to assess how effectively a company can generate returns on the investment it received from its shareholders. In simpler terms, it measures the profitability of a company in relation to shareholder's equity.
See our latest analysis for CMO Group
How Is ROE Calculated?
The formula for ROE is:
Return on Equity = Net Profit (from continuing operations) ÷ Shareholders' Equity
So, based on the above formula, the ROE for CMO Group is:
2.0% = UK£367k ÷ UK£18m (Based on the trailing twelve months to December 2022).
The 'return' refers to a company's earnings over the last year. So, this means that for every £1 of its shareholder's investments, the company generates a profit of £0.02.
What Has ROE Got To Do With Earnings Growth?
So far, we've learned that ROE is a measure of a company's profitability. Depending on how much of these profits the company reinvests or "retains", and how effectively it does so, we are then able to assess a company’s earnings growth potential. Generally speaking, other things being equal, firms with a high return on equity and profit retention, have a higher growth rate than firms that don’t share these attributes.
CMO Group's Earnings Growth And 2.0% ROE
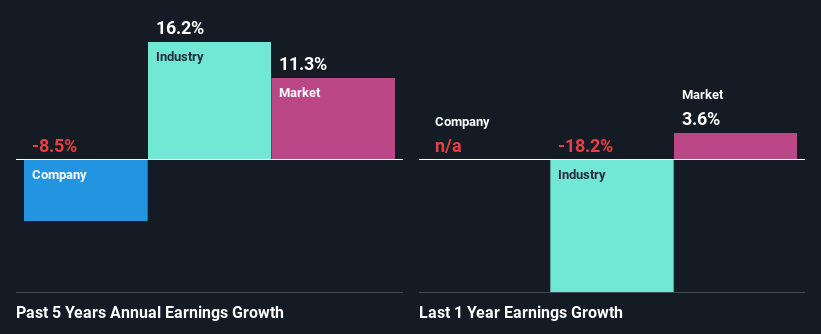
It is quite clear that CMO Group's ROE is rather low. Even compared to the average industry ROE of 14%, the company's ROE is quite dismal. Therefore, it might not be wrong to say that the five year net income decline of 8.5% seen by CMO Group was possibly a result of it having a lower ROE. We reckon that there could also be other factors at play here. For instance, the company has a very high payout ratio, or is faced with competitive pressures.
So, as a next step, we compared CMO Group's performance against the industry and were disappointed to discover that while the company has been shrinking its earnings, the industry has been growing its earnings at a rate of 16% over the last few years.
Earnings growth is an important metric to consider when valuing a stock. The investor should try to establish if the expected growth or decline in earnings, whichever the case may be, is priced in. By doing so, they will have an idea if the stock is headed into clear blue waters or if swampy waters await. One good indicator of expected earnings growth is the P/E ratio which determines the price the market is willing to pay for a stock based on its earnings prospects. So, you may want to check if CMO Group is trading on a high P/E or a low P/E, relative to its industry.
Is CMO Group Making Efficient Use Of Its Profits?
Because CMO Group doesn't pay any dividends, we infer that it is retaining all of its profits, which is rather perplexing when you consider the fact that there is no earnings growth to show for it. It looks like there might be some other reasons to explain the lack in that respect. For example, the business could be in decline.
Conclusion
On the whole, we feel that the performance shown by CMO Group can be open to many interpretations. While the company does have a high rate of profit retention, its low rate of return is probably hampering its earnings growth. Wrapping up, we would proceed with caution with this company and one way of doing that would be to look at the risk profile of the business. You can see the 1 risk we have identified for CMO Group by visiting our risks dashboard for free on our platform here.
Have feedback on this article? Concerned about the content? Get in touch with us directly. Alternatively, email editorial-team (at) simplywallst.com.
This article by Simply Wall St is general in nature. We provide commentary based on historical data and analyst forecasts only using an unbiased methodology and our articles are not intended to be financial advice. It does not constitute a recommendation to buy or sell any stock, and does not take account of your objectives, or your financial situation. We aim to bring you long-term focused analysis driven by fundamental data. Note that our analysis may not factor in the latest price-sensitive company announcements or qualitative material. Simply Wall St has no position in any stocks mentioned.
