
 Yahoo Finance
 CNO Financial (CNO) Q1 Earnings Miss on Higher Expenses
CNO Financial Group, Inc. CNO reported first-quarter 2024 adjusted earnings per share (EPS) of 52 cents, which missed the Zacks Consensus Estimate by 18.8%. However, the bottom line rose 2% year over year.
Total revenues increased 14.9% year over year to $1.2 billion in the first quarter. The top line beat the consensus mark by 23.6%.
The weaker-than-expected first-quarter earnings results were impacted by rising benefits and expenses and lower fee revenue and other income. However, the negatives were partially offset by increased investment income, premiums and general account assets.
CNO Financial Group, Inc. Price, Consensus and EPS Surprise
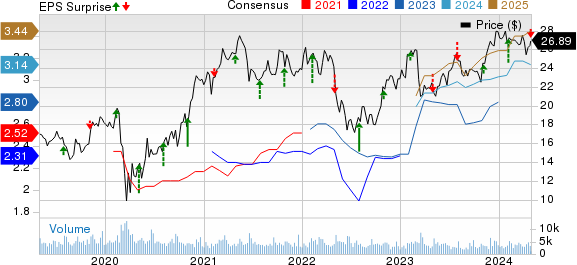
CNO Financial Group, Inc. price-consensus-eps-surprise-chart | CNO Financial Group, Inc. Quote
First-Quarter Performance
Total insurance policy income of $628.4 million improved 0.5% year over year but missed the Zacks Consensus Estimate by 1.1% due to a decline in health insurance policy income.
CNO’s net investment income increased 36.8% year over year to $469.2 million in the first quarter. General account assets grew 3.3% year over year to $301.9 million but missed the consensus mark by 1.2%. Also, the policyholder and other special-purpose portfolios jumped more than two times to $167.3 million.
Annuity collected premiums of $393.3 million increased 6% year over year. New annualized premiums for health and life products advanced 8.2% year over year to $104.5 million. Annuity, Health and Life products accounted for 22.6%, 53.6% and 23.8%, respectively, of CNO’s insurance margin.
Total benefits and expenses were $1 billion, which inched up 0.3% year over year. The increase in the metric was attributable to higher insurance policy benefits, interest expenses and other operating costs.
Financial Update (as of Mar 31, 2024)
CNO Financial exited the first quarter with unrestricted cash and cash equivalents of $566.3 million, which decreased from the 2023-end level of $774.5 million. Total assets of $34.9 billion declined from $35.1 billion at 2023-end.
The debt-to-capital ratio was 32.5% at the first-quarter end. It has no outstanding debt maturities till 2025.
Total shareholders’ equity jumped to $2.4 billion from $2.2 billion as of Dec 31, 2023.
Book value per diluted share increased to $21.81 in the first quarter from $20.26 at 2023-end. Adjusted operating return on equity came in at 9.7%, which deteriorated from 10.3% a year ago.
2024 Guidance Reaffirmed
CNO Financial now expects 2024 EPS in the range of $3.10-$3.30, indicating an increase from the 2023 figure of $3.09. The company expects the expense ratio in the range of 18.8%-19.2% for 2024, improving from the 2023 level of 19.4%. It anticipates the effective tax rate for 2024 to be around 23%. It is also aiming at a leverage of 25%-28% for this year.
Share Repurchase and Dividend Update
CNO Financial rewarded its shareholders with $57.3 million in the form of share buybacks and dividends of $17.3 million.
As of Mar 31, 2024, the company had remaining repurchase funds of $481.8 million.
Zacks Rank
CNO Financial currently carries a Zacks Rank #3 (Hold). You can see the complete list of today’s Zacks #1 Rank (Strong Buy) stocks here.
Performance of Other Insurers
Of the insurance industry players that have reported first-quarter 2024 results so far, the bottom-line results of Chubb Limited CB, RLI Corp. RLI and W. R. Berkley Corporation WRB beat the respective Zacks Consensus Estimate.
Chubb reported first-quarter 2024 core operating income of $5.41 per share, which outpaced the Zacks Consensus Estimate by 2.3%. The bottom line increased 22.7% year over year. Net premiums written improved 14.1% year over year to $12.2 billion in the quarter. Net investment income of CB was $1.4 billion, up 25.7% year over year.
Property and Casualty (P&C) underwriting income was $1.4 billion, up 16.7% year over year. Global P&C underwriting income, excluding Agriculture, was $1.3 billion, up 10.9%. The P&C combined ratio improved 30 bps on a year-over-year basis to 86%. The North America Commercial P&C Insurance segment’s net premiums written increased 9.4% year over year to $4.7 billion while the Overseas General Insurance unit generated net premiums written of $3.8 billion (up 17.5% year over year).
RLI’s first-quarter 2024 operating earnings of $1.89 per share beat the Zacks Consensus Estimate, as well as the year-ago number by 16%. Operating revenues for the reported quarter were $394 million, up 17.6% year over year, driven by 17% higher net premiums earned and 21.3% higher net investment income. The top line, however, missed the consensus estimate by 0.1%. Gross premiums written of RLI increased 13% year over year to $468 million.
Net investment income increased 21% year over year to $32.8 million. The investment portfolio’s total return was 1.8% in the quarter. Underwriting income of $77.7 million increased 16%. The combined ratio deteriorated 60 bps year over year to 78.5.
W.R. Berkley reported first-quarter 2024 operating income of $1.56 per share, which beat the Zacks Consensus Estimate of $1.46 by 6.9%. The bottom line improved 56% year over year. Its net premiums written were a record $2.9 billion, up 10.7% year over year. Operating revenues were $3.2 billion, up 11.6% year over year. The top line beat the consensus estimate by 0.2%.
WRB’s net investment income surged 43.2% to a record $319.8 million, driven by a 63.2% increase in the core portfolio. Pre-tax underwriting income increased 31.8% to $309 million. The consolidated combined ratio (a measure of underwriting profitability) improved 180 bps year over year to 88.8. Net premiums in the Insurance segment increased 11.9% year over year to $2.4 billion in the quarter, while net premiums written in the Reinsurance & Monoline Excess segment increased 4.2% year over year to $405.6 million.
Want the latest recommendations from Zacks Investment Research? Today, you can download 7 Best Stocks for the Next 30 Days. Click to get this free report
RLI Corp. (RLI) : Free Stock Analysis Report
CNO Financial Group, Inc. (CNO) : Free Stock Analysis Report
Chubb Limited (CB) : Free Stock Analysis Report
W.R. Berkley Corporation (WRB) : Free Stock Analysis Report
