
 Yahoo Finance
 Cobham plc (LON:COB): Does The Earnings Decline Make It An Underperformer?

Want to participate in a short research study? Help shape the future of investing tools and you could win a $250 gift card!
When Cobham plc's (LON:COB) announced its latest earnings (31 December 2018), I wanted to understand how these figures stacked up against its past performance. The two benchmarks I used were Cobham's average earnings over the past couple of years, and its industry performance. These are useful yardsticks to help me gauge whether or not COB actually performed well. Below is a quick commentary on how I see COB has performed.
View our latest analysis for Cobham
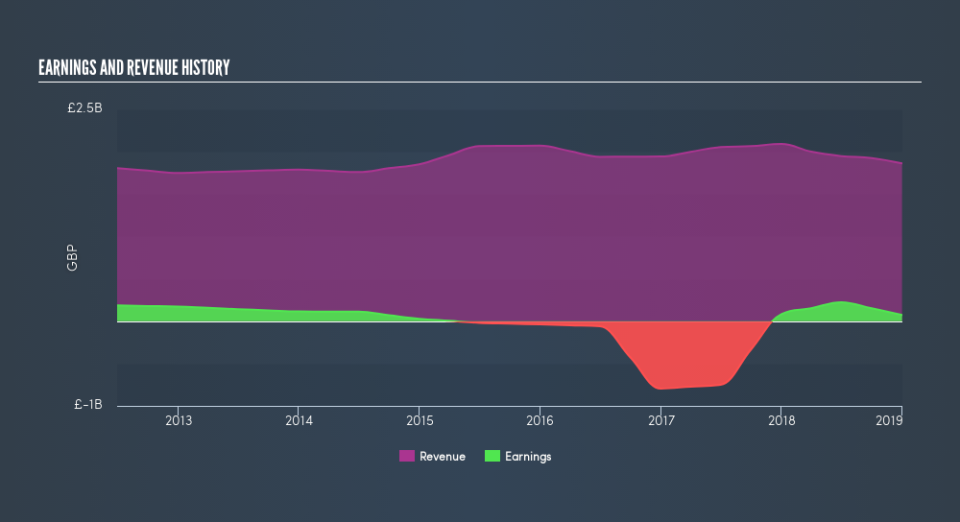
Was COB's weak performance lately a part of a long-term decline?
COB recently turned a profit of UK£74m (most recent trailing twelve-months) compared to its average loss of -UK£43.9m over the past five years.
In terms of returns from investment, Cobham has fallen short of achieving a 20% return on equity (ROE), recording 6.2% instead. Furthermore, its return on assets (ROA) of 3.4% is below the GB Aerospace & Defense industry of 6.0%, indicating Cobham's are utilized less efficiently. However, its return on capital (ROC), which also accounts for Cobham’s debt level, has increased over the past 3 years from 4.7% to 5.8%. This correlates with a decrease in debt holding, with debt-to-equity ratio declining from 63% to 33% over the past 5 years.
What does this mean?
While past data is useful, it doesn’t tell the whole story. Companies that are profitable, but have volatile earnings, can have many factors affecting its business. You should continue to research Cobham to get a better picture of the stock by looking at:
Future Outlook: What are well-informed industry analysts predicting for COB’s future growth? Take a look at our free research report of analyst consensus for COB’s outlook.
Financial Health: Are COB’s operations financially sustainable? Balance sheets can be hard to analyze, which is why we’ve done it for you. Check out our financial health checks here.
Other High-Performing Stocks: Are there other stocks that provide better prospects with proven track records? Explore our free list of these great stocks here.
NB: Figures in this article are calculated using data from the trailing twelve months from 31 December 2018. This may not be consistent with full year annual report figures.
We aim to bring you long-term focused research analysis driven by fundamental data. Note that our analysis may not factor in the latest price-sensitive company announcements or qualitative material.
If you spot an error that warrants correction, please contact the editor at editorial-team@simplywallst.com. This article by Simply Wall St is general in nature. It does not constitute a recommendation to buy or sell any stock, and does not take account of your objectives, or your financial situation. Simply Wall St has no position in the stocks mentioned. Thank you for reading.
