
 Yahoo Finance
 What Is Coca-Cola HBC's (LON:CCH) P/E Ratio After Its Share Price Tanked?

Unfortunately for some shareholders, the Coca-Cola HBC (LON:CCH) share price has dived 34% in the last thirty days. Indeed the recent decline has arguably caused some bitterness for shareholders who have held through the 33% drop over twelve months.
Assuming nothing else has changed, a lower share price makes a stock more attractive to potential buyers. While the market sentiment towards a stock is very changeable, in the long run, the share price will tend to move in the same direction as earnings per share. The implication here is that long term investors have an opportunity when expectations of a company are too low. One way to gauge market expectations of a stock is to look at its Price to Earnings Ratio (PE Ratio). A high P/E implies that investors have high expectations of what a company can achieve compared to a company with a low P/E ratio.
See our latest analysis for Coca-Cola HBC
Does Coca-Cola HBC Have A Relatively High Or Low P/E For Its Industry?
We can tell from its P/E ratio of 14.35 that sentiment around Coca-Cola HBC isn't particularly high. If you look at the image below, you can see Coca-Cola HBC has a lower P/E than the average (17.5) in the beverage industry classification.
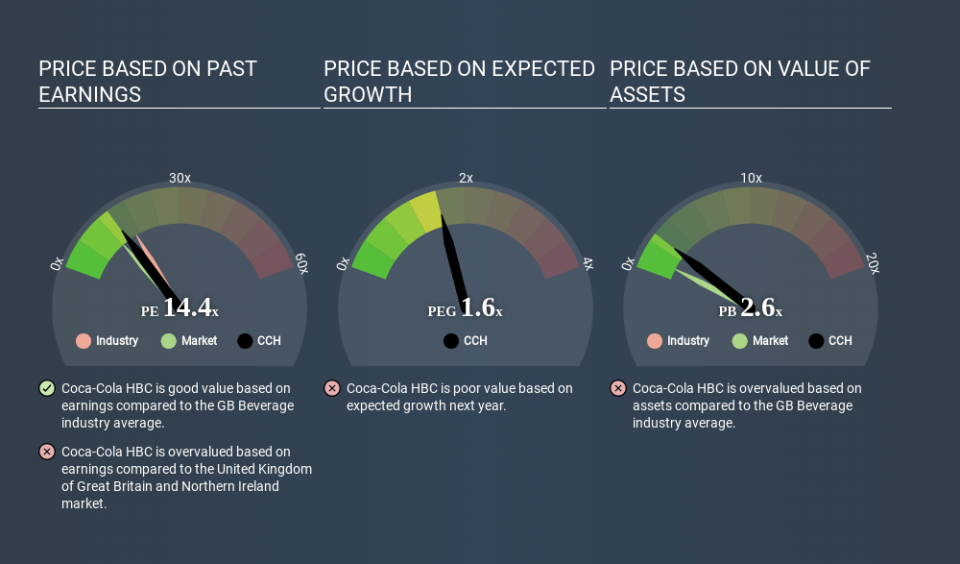
Its relatively low P/E ratio indicates that Coca-Cola HBC shareholders think it will struggle to do as well as other companies in its industry classification. Many investors like to buy stocks when the market is pessimistic about their prospects. If you consider the stock interesting, further research is recommended. For example, I often monitor director buying and selling.
How Growth Rates Impact P/E Ratios
P/E ratios primarily reflect market expectations around earnings growth rates. Earnings growth means that in the future the 'E' will be higher. That means unless the share price increases, the P/E will reduce in a few years. Then, a lower P/E should attract more buyers, pushing the share price up.
It's great to see that Coca-Cola HBC grew EPS by 10% in the last year. And it has bolstered its earnings per share by 11% per year over the last five years. So one might expect an above average P/E ratio.
Remember: P/E Ratios Don't Consider The Balance Sheet
Don't forget that the P/E ratio considers market capitalization. That means it doesn't take debt or cash into account. Theoretically, a business can improve its earnings (and produce a lower P/E in the future) by investing in growth. That means taking on debt (or spending its cash).
Such expenditure might be good or bad, in the long term, but the point here is that the balance sheet is not reflected by this ratio.
So What Does Coca-Cola HBC's Balance Sheet Tell Us?
Coca-Cola HBC's net debt is 22% of its market cap. This could bring some additional risk, and reduce the number of investment options for management; worth remembering if you compare its P/E to businesses without debt.
The Bottom Line On Coca-Cola HBC's P/E Ratio
Coca-Cola HBC trades on a P/E ratio of 14.4, which is above its market average of 12.7. Its debt levels do not imperil its balance sheet and it is growing EPS strongly. Therefore, it's not particularly surprising that it has a above average P/E ratio. Given Coca-Cola HBC's P/E ratio has declined from 21.7 to 14.4 in the last month, we know for sure that the market is significantly less confident about the business today, than it was back then. For those who don't like to trade against momentum, that could be a warning sign, but a contrarian investor might want to take a closer look.
When the market is wrong about a stock, it gives savvy investors an opportunity. If the reality for a company is better than it expects, you can make money by buying and holding for the long term. So this free visualization of the analyst consensus on future earnings could help you make the right decision about whether to buy, sell, or hold.
Of course, you might find a fantastic investment by looking at a few good candidates. So take a peek at this free list of companies with modest (or no) debt, trading on a P/E below 20.
If you spot an error that warrants correction, please contact the editor at editorial-team@simplywallst.com. This article by Simply Wall St is general in nature. It does not constitute a recommendation to buy or sell any stock, and does not take account of your objectives, or your financial situation. Simply Wall St has no position in the stocks mentioned.
We aim to bring you long-term focused research analysis driven by fundamental data. Note that our analysis may not factor in the latest price-sensitive company announcements or qualitative material. Thank you for reading.
