
 Yahoo Finance
 Is Comerica Incorporated’s (NYSE:CMA) 10.28% ROE Strong Compared To Its Industry?

I am writing today to help inform people who are new to the stock market and want to begin learning the link between Comerica Incorporated (NYSE:CMA)’s return fundamentals and stock market performance.
With an ROE of 10.28%, Comerica Incorporated (NYSE:CMA) outpaced its own industry which delivered a less exciting 8.48% over the past year. Superficially, this looks great since we know that CMA has generated big profits with little equity capital; however, ROE doesn’t tell us how much CMA has borrowed in debt. In this article, we’ll closely examine some factors like financial leverage to evaluate the sustainability of CMA’s ROE. See our latest analysis for Comerica
Breaking down Return on Equity
Return on Equity (ROE) weighs Comerica’s profit against the level of its shareholders’ equity. It essentially shows how much the company can generate in earnings given the amount of equity it has raised. Generally speaking, a higher ROE is preferred; however, there are other factors we must also consider before making any conclusions.
Return on Equity = Net Profit ÷ Shareholders Equity
Returns are usually compared to costs to measure the efficiency of capital. Comerica’s cost of equity is 9.96%. Given a positive discrepancy of 0.32% between return and cost, this indicates that Comerica pays less for its capital than what it generates in return, which is a sign of capital efficiency. ROE can be dissected into three distinct ratios: net profit margin, asset turnover, and financial leverage. This is called the Dupont Formula:
Dupont Formula
ROE = profit margin × asset turnover × financial leverage
ROE = (annual net profit ÷ sales) × (sales ÷ assets) × (assets ÷ shareholders’ equity)
ROE = annual net profit ÷ shareholders’ equity

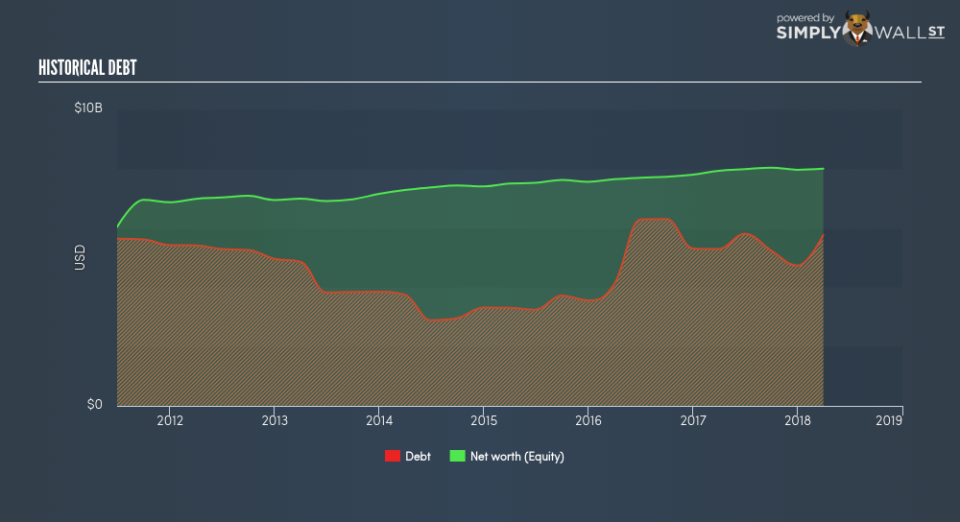
The first component is profit margin, which measures how much of sales is retained after the company pays for all its expenses. Asset turnover reveals how much revenue can be generated from Comerica’s asset base. And finally, financial leverage is simply how much of assets are funded by equity, which exhibits how sustainable the company’s capital structure is. Since financial leverage can artificially inflate ROE, we need to look at how much debt Comerica currently has. The debt-to-equity ratio currently stands at a sensible 72.09%, meaning the above-average ROE is due to its capacity to produce profit growth without a huge debt burden.
Next Steps:
ROE is one of many ratios which meaningfully dissects financial statements, which illustrates the quality of a company. Comerica’s ROE is impressive relative to the industry average and also covers its cost of equity. Its high ROE is not likely to be driven by high debt. Therefore, investors may have more confidence in the sustainability of this level of returns going forward. ROE is a helpful signal, but it is definitely not sufficient on its own to make an investment decision.
For Comerica, I’ve put together three important factors you should look at:
Financial Health: Does it have a healthy balance sheet? Take a look at our free balance sheet analysis with six simple checks on key factors like leverage and risk.
Valuation: What is Comerica worth today? Is the stock undervalued, even when its growth outlook is factored into its intrinsic value? The intrinsic value infographic in our free research report helps visualize whether Comerica is currently mispriced by the market.
Other High-Growth Alternatives : Are there other high-growth stocks you could be holding instead of Comerica? Explore our interactive list of stocks with large growth potential to get an idea of what else is out there you may be missing!
To help readers see pass the short term volatility of the financial market, we aim to bring you a long-term focused research analysis purely driven by fundamental data. Note that our analysis does not factor in the latest price sensitive company announcements.
The author is an independent contributor and at the time of publication had no position in the stocks mentioned.
