
 Yahoo Finance
 Compass Diversified Holdings's Dividend Analysis
Assessing the Sustainability of CODI's Dividends
Compass Diversified Holdings (NYSE:CODI) recently announced a dividend of $0.25 per share, payable on 2024-04-25, with the ex-dividend date set for 2024-04-17. As investors look forward to this upcoming payment, the spotlight also shines on the company's dividend history, yield, and growth rates. Using the data from GuruFocus, let's look into Compass Diversified Holdings's dividend performance and assess its sustainability.
What Does Compass Diversified Holdings Do?
This Powerful Chart Made Peter Lynch 29% A Year For 13 Years
How to calculate the intrinsic value of a stock?
Compass Diversified Holdings is a diversified business conglomerate based in the United States having two groups: branded consumer business and industrial business. Branded consumer businesses are characterized as those businesses that capitalize on a valuable brand name in their respective market sector. It includes 5.11, Ergobaby, Liberty Safe, and Velocity Outdoor. Industrial businesses are characterized as those businesses that focus on manufacturing and selling particular products and industrial services within a specific market sector. The company has operations in the United States, Canada, Europe, Asia Pacific, and other International areas.

A Glimpse at Compass Diversified Holdings's Dividend History
Compass Diversified Holdings has maintained a consistent dividend payment record since 2006. Dividends are currently distributed on a quarterly basis. Below is a chart showing annual Dividends Per Share for tracking historical trends.
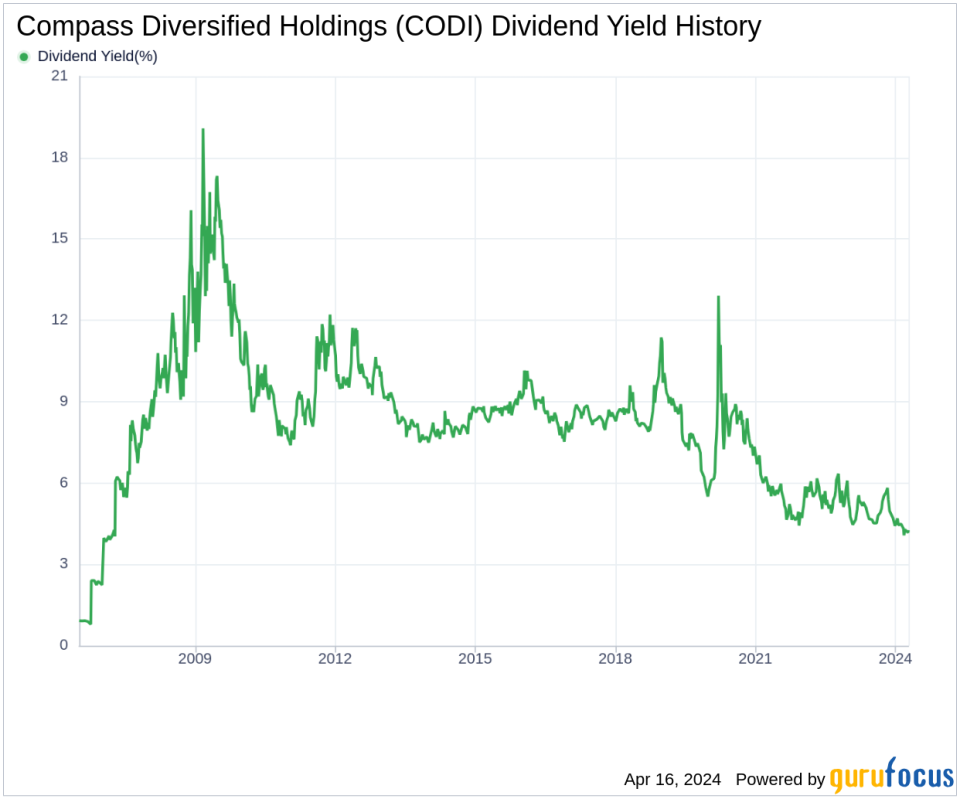
Breaking Down Compass Diversified Holdings's Dividend Yield and Growth
As of today, Compass Diversified Holdings currently has a 12-month trailing dividend yield of 4.36% and a 12-month forward dividend yield of 4.36%. This suggests an expectation of the same dividend payments over the next 12 months.
Over the past three years, Compass Diversified Holdings's annual dividend growth rate was -11.40%. Extended to a five-year horizon, this rate increased to -8.00% per year. And over the past decade, Compass Diversified Holdings's annual dividends per share growth rate stands at -2.90%.
Based on Compass Diversified Holdings's dividend yield and five-year growth rate, the 5-year yield on cost of Compass Diversified Holdings stock as of today is approximately 2.87%.
The Sustainability Question: Payout Ratio and Profitability
To assess the sustainability of the dividend, one needs to evaluate the company's payout ratio. The dividend payout ratio provides insights into the portion of earnings the company distributes as dividends. A lower ratio suggests that the company retains a significant part of its earnings, thereby ensuring the availability of funds for future growth and unexpected downturns. As of 2023-12-31, Compass Diversified Holdings's dividend payout ratio is 0.42.
Compass Diversified Holdings's profitability rank, offers an understanding of the company's earnings prowess relative to its peers. GuruFocus ranks Compass Diversified Holdings's profitability 7 out of 10 as of 2023-12-31, suggesting good profitability prospects. The company has reported net profit in 9 years out of the past 10 years.
Growth Metrics: The Future Outlook
To ensure the sustainability of dividends, a company must have robust growth metrics. Compass Diversified Holdings's growth rank of 7 out of 10 suggests that the company's growth trajectory is good relative to its competitors.
Revenue is the lifeblood of any company, and Compass Diversified Holdings's revenue per share, combined with the 3-year revenue growth rate, indicates a strong revenue model. Compass Diversified Holdings's revenue has increased by approximately 7.60% per year on average, a rate that outperforms approximately 52.5% of global competitors.
The company's 3-year EPS growth rate showcases its capability to grow its earnings, a critical component for sustaining dividends in the long run. During the past three years, Compass Diversified Holdings's earnings increased by approximately -13.30% per year on average, a rate that outperforms approximately 17.29% of global competitors.
Lastly, the company's 5-year EBITDA growth rate of 11.00%, which outperforms approximately 55.29% of global competitors.
Conclusion: Evaluating CODI's Dividend Prospects
When considering Compass Diversified Holdings's dividend payments, growth rate, payout ratio, profitability, and growth metrics, investors are presented with a multifaceted view of the company's financial health. While the dividend growth rate has shown a downward trend, the company's solid profitability rank and positive growth metrics may provide some reassurance about the future. The payout ratio indicates a balance between returning income to shareholders and retaining earnings for growth, suggesting a level of prudence in Compass Diversified Holdings's dividend policy. As investors weigh these factors, they must also consider the broader economic conditions and the company's strategic direction to determine the long-term sustainability of its dividends.
GuruFocus Premium users can screen for high-dividend yield stocks using the High Dividend Yield Screener.
This article, generated by GuruFocus, is designed to provide general insights and is not tailored financial advice. Our commentary is rooted in historical data and analyst projections, utilizing an impartial methodology, and is not intended to serve as specific investment guidance. It does not formulate a recommendation to purchase or divest any stock and does not consider individual investment objectives or financial circumstances. Our objective is to deliver long-term, fundamental data-driven analysis. Be aware that our analysis might not incorporate the most recent, price-sensitive company announcements or qualitative information. GuruFocus holds no position in the stocks mentioned herein.
This article first appeared on GuruFocus.
