
 Yahoo Finance
 Compass Group PLC's (LON:CPG) Has Had A Decent Run On The Stock market: Are Fundamentals In The Driver's Seat?
Most readers would already know that Compass Group's (LON:CPG) stock increased by 3.5% over the past three months. Given that stock prices are usually aligned with a company's financial performance in the long-term, we decided to investigate if the company's decent financials had a hand to play in the recent price move. Particularly, we will be paying attention to Compass Group's ROE today.
ROE or return on equity is a useful tool to assess how effectively a company can generate returns on the investment it received from its shareholders. Simply put, it is used to assess the profitability of a company in relation to its equity capital.
Check out our latest analysis for Compass Group
How To Calculate Return On Equity?
ROE can be calculated by using the formula:
Return on Equity = Net Profit (from continuing operations) ÷ Shareholders' Equity
So, based on the above formula, the ROE for Compass Group is:
19% = UK£1.1b ÷ UK£5.9b (Based on the trailing twelve months to September 2022).
The 'return' refers to a company's earnings over the last year. So, this means that for every £1 of its shareholder's investments, the company generates a profit of £0.19.
What Is The Relationship Between ROE And Earnings Growth?
We have already established that ROE serves as an efficient profit-generating gauge for a company's future earnings. We now need to evaluate how much profit the company reinvests or "retains" for future growth which then gives us an idea about the growth potential of the company. Generally speaking, other things being equal, firms with a high return on equity and profit retention, have a higher growth rate than firms that don’t share these attributes.
A Side By Side comparison of Compass Group's Earnings Growth And 19% ROE
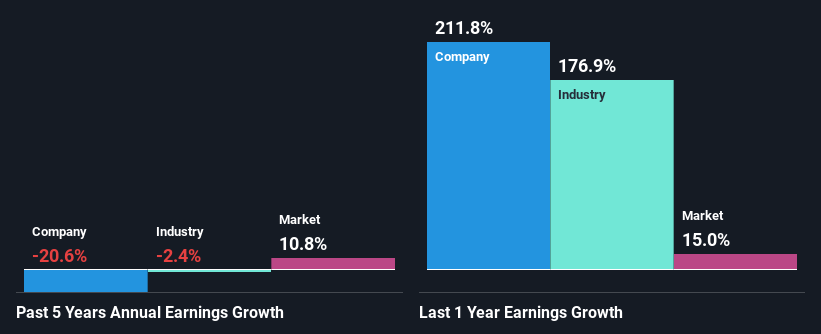
To begin with, Compass Group seems to have a respectable ROE. On comparing with the average industry ROE of 11% the company's ROE looks pretty remarkable. As you might expect, the 21% net income decline reported by Compass Group is a bit of a surprise. We reckon that there could be some other factors at play here that are preventing the company's growth. For example, it could be that the company has a high payout ratio or the business has allocated capital poorly, for instance.
Furthermore, even when compared to the industry, which has been shrinking its earnings at a rate 2.4% in the same period, we found that Compass Group's performance is pretty disappointing, as it suggests that the company has been shrunk its earnings at a rate faster than the industry.
Earnings growth is an important metric to consider when valuing a stock. It’s important for an investor to know whether the market has priced in the company's expected earnings growth (or decline). Doing so will help them establish if the stock's future looks promising or ominous. Has the market priced in the future outlook for CPG? You can find out in our latest intrinsic value infographic research report.
Is Compass Group Using Its Retained Earnings Effectively?
Compass Group has a high three-year median payout ratio of 56% (that is, it is retaining 44% of its profits). This suggests that the company is paying most of its profits as dividends to its shareholders. This goes some way in explaining why its earnings have been shrinking. The business is only left with a small pool of capital to reinvest - A vicious cycle that doesn't benefit the company in the long-run.
Moreover, Compass Group has been paying dividends for at least ten years or more suggesting that management must have perceived that the shareholders prefer dividends over earnings growth. Based on the latest analysts' estimates, we found that the company's future payout ratio over the next three years is expected to hold steady at 50%. However, Compass Group's ROE is predicted to rise to 25% despite there being no anticipated change in its payout ratio.
Summary
In total, it does look like Compass Group has some positive aspects to its business. Although, we are disappointed to see a lack of growth in earnings even in spite of a high ROE. Bear in mind, the company reinvests a small portion of its profits, which means that investors aren't reaping the benefits of the high rate of return. With that said, we studied the latest analyst forecasts and found that while the company has shrunk its earnings in the past, analysts expect its earnings to grow in the future. Are these analysts expectations based on the broad expectations for the industry, or on the company's fundamentals? Click here to be taken to our analyst's forecasts page for the company.
Have feedback on this article? Concerned about the content? Get in touch with us directly. Alternatively, email editorial-team (at) simplywallst.com.
This article by Simply Wall St is general in nature. We provide commentary based on historical data and analyst forecasts only using an unbiased methodology and our articles are not intended to be financial advice. It does not constitute a recommendation to buy or sell any stock, and does not take account of your objectives, or your financial situation. We aim to bring you long-term focused analysis driven by fundamental data. Note that our analysis may not factor in the latest price-sensitive company announcements or qualitative material. Simply Wall St has no position in any stocks mentioned.
Join A Paid User Research Session
You’ll receive a US$30 Amazon Gift card for 1 hour of your time while helping us build better investing tools for the individual investors like yourself. Sign up here
