
 Yahoo Finance
 Should You Be Concerned About Future Data Group Limited’s (HKG:8229) Historical Volatility?

If you’re interested in Future Data Group Limited (HKG:8229), then you might want to consider its beta (a measure of share price volatility) in order to understand how the stock could impact your portfolio. Volatility is considered to be a measure of risk in modern finance theory. Investors may think of volatility as falling into two main categories. First, we have company specific volatility, which is the price gyrations of an individual stock. Holding at least 8 stocks can reduce this kind of risk across a portfolio. The second type is the broader market volatility, which you cannot diversify away, since it arises from macroeconomic factors which directly affects all the stocks on the market.
Some stocks are more sensitive to general market forces than others. Beta is a widely used metric to measure a stock’s exposure to market risk (volatility). Before we go on, it’s worth noting that Warren Buffett pointed out in his 2014 letter to shareholders that ‘volatility is far from synonymous with risk.’ Having said that, beta can still be rather useful. The first thing to understand about beta is that the beta of the overall market is one. A stock with a beta below one is either less volatile than the market, or more volatile but not corellated with the overall market. In comparison a stock with a beta of over one tends to be move in a similar direction to the market in the long term, but with greater changes in price.
See our latest analysis for Future Data Group
What 8229’s beta value tells investors
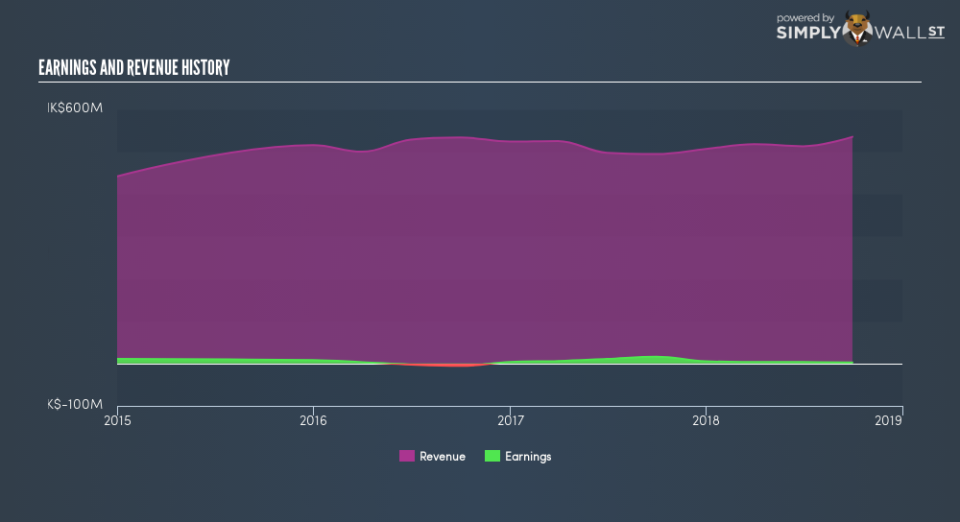
As it happens, Future Data Group has a five year beta of 1.06. This is fairly close to 1, so the stock has historically shown a somewhat similar level of volatility as the market. Using history as a guide, we might surmise that the share price is likely to be influenced by market voltility going forward but it probably won’t be particularly sensitive to it. Many would argue that beta is useful in position sizing, but fundamental metrics such as revenue and earnings are more important overall. You can see Future Data Group’s revenue and earnings in the image below.
Could 8229’s size cause it to be more volatile?
Future Data Group is a noticeably small company, with a market capitalisation of HK$78m. Most companies this size are not always actively traded. It doesn’t take much money to really move the share price of a company as small as this one. That makes it somewhat unusual that it has a beta value so close to the overall market.
What this means for you:
It is probable that there is a link between the share price of Future Data Group and the broader market, since it has a beta value quite close to one. However, long term investors are generally well served by looking past market volatility and focussing on the underlying development of the business. If that’s your game, metrics such as revenue, earnings and cash flow will be more useful. This article aims to educate investors about beta values, but it’s well worth looking at important company-specific fundamentals such as Future Data Group’s financial health and performance track record. I highly recommend you dive deeper by considering the following:
Future Outlook: What are well-informed industry analysts predicting for 8229’s future growth? Take a look at our free research report of analyst consensus for 8229’s outlook.
Financial Health: Are 8229’s operations financially sustainable? Balance sheets can be hard to analyze, which is why we’ve done it for you. Check out our financial health checks here.
Other High-Performing Stocks: Are there other stocks that provide better prospects with proven track records? Explore our free list of these great stocks here.
To help readers see past the short term volatility of the financial market, we aim to bring you a long-term focused research analysis purely driven by fundamental data. Note that our analysis does not factor in the latest price-sensitive company announcements.
The author is an independent contributor and at the time of publication had no position in the stocks mentioned. For errors that warrant correction please contact the editor at editorial-team@simplywallst.com.
