
 Yahoo Finance
 Should You Be Concerned About Turning Point Brands, Inc.'s (NYSE:TPB) ROE?

One of the best investments we can make is in our own knowledge and skill set. With that in mind, this article will work through how we can use Return On Equity (ROE) to better understand a business. To keep the lesson grounded in practicality, we'll use ROE to better understand Turning Point Brands, Inc. (NYSE:TPB).
Return on Equity or ROE is a test of how effectively a company is growing its value and managing investors’ money. Put another way, it reveals the company's success at turning shareholder investments into profits.
Check out our latest analysis for Turning Point Brands
How To Calculate Return On Equity?
The formula for return on equity is:
Return on Equity = Net Profit (from continuing operations) ÷ Shareholders' Equity
So, based on the above formula, the ROE for Turning Point Brands is:
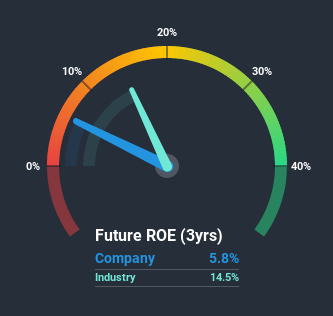
5.8% = US$6.5m ÷ US$112m (Based on the trailing twelve months to September 2020).
The 'return' refers to a company's earnings over the last year. Another way to think of that is that for every $1 worth of equity, the company was able to earn $0.06 in profit.
Does Turning Point Brands Have A Good Return On Equity?
One simple way to determine if a company has a good return on equity is to compare it to the average for its industry. However, this method is only useful as a rough check, because companies do differ quite a bit within the same industry classification. As is clear from the image below, Turning Point Brands has a lower ROE than the average (14%) in the Tobacco industry.
That certainly isn't ideal. That being said, a low ROE is not always a bad thing, especially if the company has low leverage as this still leaves room for improvement if the company were to take on more debt. A high debt company having a low ROE is a different story altogether and a risky investment in our books. Our risks dashboard should have the 4 risks we have identified for Turning Point Brands.
The Importance Of Debt To Return On Equity
Companies usually need to invest money to grow their profits. The cash for investment can come from prior year profits (retained earnings), issuing new shares, or borrowing. In the case of the first and second options, the ROE will reflect this use of cash, for growth. In the latter case, the use of debt will improve the returns, but will not change the equity. Thus the use of debt can improve ROE, albeit along with extra risk in the case of stormy weather, metaphorically speaking.
Combining Turning Point Brands' Debt And Its 5.8% Return On Equity
Turning Point Brands does use a high amount of debt to increase returns. It has a debt to equity ratio of 2.70. Its ROE is quite low, even with the use of significant debt; that's not a good result, in our opinion. Debt increases risk and reduces options for the company in the future, so you generally want to see some good returns from using it.
Conclusion
Return on equity is useful for comparing the quality of different businesses. In our books, the highest quality companies have high return on equity, despite low debt. All else being equal, a higher ROE is better.
But when a business is high quality, the market often bids it up to a price that reflects this. The rate at which profits are likely to grow, relative to the expectations of profit growth reflected in the current price, must be considered, too. So you might want to check this FREE visualization of analyst forecasts for the company.
Of course, you might find a fantastic investment by looking elsewhere. So take a peek at this free list of interesting companies.
This article by Simply Wall St is general in nature. It does not constitute a recommendation to buy or sell any stock, and does not take account of your objectives, or your financial situation. We aim to bring you long-term focused analysis driven by fundamental data. Note that our analysis may not factor in the latest price-sensitive company announcements or qualitative material. Simply Wall St has no position in any stocks mentioned.
Have feedback on this article? Concerned about the content? Get in touch with us directly. Alternatively, email editorial-team@simplywallst.com.
