
 Yahoo Finance
 Should You Be Concerned About United Utilities Group PLC's (LON:UU.) ROE?
One of the best investments we can make is in our own knowledge and skill set. With that in mind, this article will work through how we can use Return On Equity (ROE) to better understand a business. We'll use ROE to examine United Utilities Group PLC (LON:UU.), by way of a worked example.
Return on Equity or ROE is a test of how effectively a company is growing its value and managing investors’ money. In simpler terms, it measures the profitability of a company in relation to shareholder's equity.
See our latest analysis for United Utilities Group
How To Calculate Return On Equity?
The formula for ROE is:
Return on Equity = Net Profit (from continuing operations) ÷ Shareholders' Equity
So, based on the above formula, the ROE for United Utilities Group is:
2.8% = UK£75m ÷ UK£2.7b (Based on the trailing twelve months to September 2021).
The 'return' is the income the business earned over the last year. One way to conceptualize this is that for each £1 of shareholders' capital it has, the company made £0.03 in profit.
Does United Utilities Group Have A Good Return On Equity?
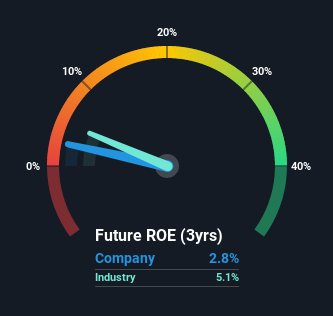
Arguably the easiest way to assess company's ROE is to compare it with the average in its industry. However, this method is only useful as a rough check, because companies do differ quite a bit within the same industry classification. If you look at the image below, you can see United Utilities Group has a lower ROE than the average (5.1%) in the Water Utilities industry classification.
That's not what we like to see. However, a low ROE is not always bad. If the company's debt levels are moderate to low, then there's still a chance that returns can be improved via the use of financial leverage. A company with high debt levels and low ROE is a combination we like to avoid given the risk involved. You can see the 3 risks we have identified for United Utilities Group by visiting our risks dashboard for free on our platform here.
Why You Should Consider Debt When Looking At ROE
Companies usually need to invest money to grow their profits. That cash can come from issuing shares, retained earnings, or debt. In the first and second cases, the ROE will reflect this use of cash for investment in the business. In the latter case, the debt required for growth will boost returns, but will not impact the shareholders' equity. In this manner the use of debt will boost ROE, even though the core economics of the business stay the same.
United Utilities Group's Debt And Its 2.8% ROE
We think United Utilities Group uses a significant amount of debt to maximize its returns, as it has a significantly higher debt to equity ratio of 3.09. We consider it to be a negative sign when a company has a rather low ROE despite a rather high debt to equity.
Conclusion
Return on equity is a useful indicator of the ability of a business to generate profits and return them to shareholders. A company that can achieve a high return on equity without debt could be considered a high quality business. If two companies have around the same level of debt to equity, and one has a higher ROE, I'd generally prefer the one with higher ROE.
But when a business is high quality, the market often bids it up to a price that reflects this. The rate at which profits are likely to grow, relative to the expectations of profit growth reflected in the current price, must be considered, too. So you might want to check this FREE visualization of analyst forecasts for the company.
If you would prefer check out another company -- one with potentially superior financials -- then do not miss this free list of interesting companies, that have HIGH return on equity and low debt.
Have feedback on this article? Concerned about the content? Get in touch with us directly. Alternatively, email editorial-team (at) simplywallst.com.
This article by Simply Wall St is general in nature. We provide commentary based on historical data and analyst forecasts only using an unbiased methodology and our articles are not intended to be financial advice. It does not constitute a recommendation to buy or sell any stock, and does not take account of your objectives, or your financial situation. We aim to bring you long-term focused analysis driven by fundamental data. Note that our analysis may not factor in the latest price-sensitive company announcements or qualitative material. Simply Wall St has no position in any stocks mentioned.
