
 Yahoo Finance
 Consider This Before Buying Fuller, Smith Turner P.L.C. (LON:FSTA) For The 1.8% Dividend

Could Fuller, Smith & Turner P.L.C. (LON:FSTA) be an attractive dividend share to own for the long haul? Investors are often drawn to strong companies with the idea of reinvesting the dividends. If you are hoping to live on your dividends, it's important to be more stringent with your investments than the average punter. Regular readers know we like to apply the same approach to each dividend stock, and we hope you'll find our analysis useful.
While Fuller Smith & Turner's 1.8% dividend yield is not the highest, we think its lengthy payment history is quite interesting. Some simple research can reduce the risk of buying Fuller Smith & Turner for its dividend - read on to learn more.
Click the interactive chart for our full dividend analysis
Payout ratios
Companies (usually) pay dividends out of their earnings. If a company is paying more than it earns, the dividend might have to be cut. As a result, we should always investigate whether a company can afford its dividend, measured as a percentage of a company's net income after tax. In the last year, Fuller Smith & Turner paid out 72% of its profit as dividends. A payout ratio above 50% generally implies a business is reaching maturity, although it is still possible to reinvest in the business or increase the dividend over time.
We also measure dividends paid against a company's levered free cash flow, to see if enough cash was generated to cover the dividend. Fuller Smith & Turner paid out 244% of its free cash last year. Cash flows can be lumpy, but this dividend was not well covered by cash flow. Paying out more than 100% of your free cash flow in dividends is generally not a long-term, sustainable state of affairs, so we think shareholders should watch this metric closely. Fuller Smith & Turner paid out less in dividends than it reported in profits, but unfortunately it didn't generate enough free cash flow to cover the dividend. Were it to repeatedly pay dividends that were not well covered by cash flow, this could be a risk to Fuller Smith & Turner's ability to maintain its dividend.
Is Fuller Smith & Turner's Balance Sheet Risky?
As Fuller Smith & Turner has a meaningful amount of debt, we need to check its balance sheet to see if the company might have debt risks. A quick check of its financial situation can be done with two ratios: net debt divided by EBITDA (earnings before interest, tax, depreciation and amortisation), and net interest cover. Net debt to EBITDA is a measure of a company's total debt. Net interest cover measures the ability to meet interest payments. Essentially we check that a) the company does not have too much debt, and b) that it can afford to pay the interest. Fuller Smith & Turner has net debt of 5.15 times its EBITDA, which implies meaningful risk if interest rates rise of earnings decline.
Net interest cover can be calculated by dividing earnings before interest and tax (EBIT) by the company's net interest expense. With EBIT of 4.18 times its interest expense, Fuller Smith & Turner's interest cover is starting to look a bit thin. High debt and weak interest cover are not a great combo, and we would be cautious of relying on this company's dividend while these metrics persist.
Remember, you can always get a snapshot of Fuller Smith & Turner's latest financial position, by checking our visualisation of its financial health.
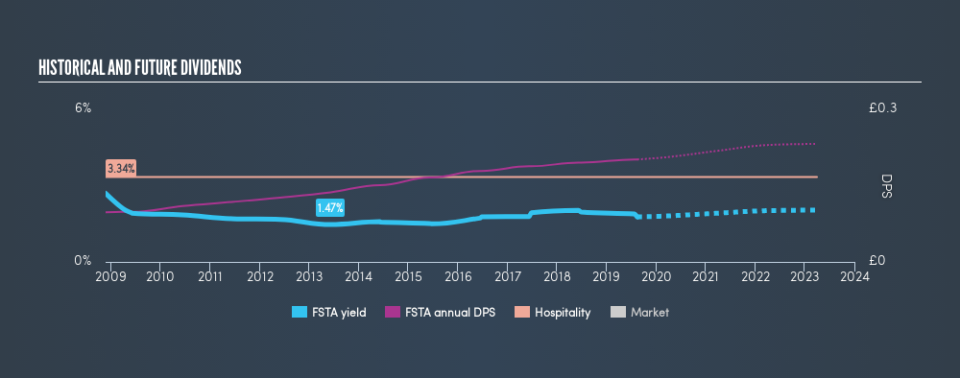
Dividend Volatility
Before buying a stock for its income, we want to see if the dividends have been stable in the past, and if the company has a track record of maintaining its dividend. For the purpose of this article, we only scrutinise the last decade of Fuller Smith & Turner's dividend payments. During this period the dividend has been stable, which could imply the business could have relatively consistent earnings power. During the past ten-year period, the first annual payment was UK£0.098 in 2009, compared to UK£0.20 last year. This works out to be a compound annual growth rate (CAGR) of approximately 7.5% a year over that time.
Businesses that can grow their dividends at a decent rate and maintain a stable payout can generate substantial wealth for shareholders over the long term.
Dividend Growth Potential
Dividend payments have been consistent over the past few years, but we should always check if earnings per share (EPS) are growing, as this will help maintain the purchasing power of the dividend. Over the past five years, it looks as though Fuller Smith & Turner's EPS have declined at around 12% a year. With this kind of significant decline, we always wonder what has changed in the business. Dividends are about stability, and Fuller Smith & Turner's earnings per share, which support the dividend, have been anything but stable.
Conclusion
Dividend investors should always want to know if a) a company's dividends are affordable, b) if there is a track record of consistent payments, and c) if the dividend is capable of growing. First, the company has a payout ratio that was within an average range for most dividend stocks, but it paid out virtually all of its generated cash flow. It hasn't demonstrated a strong ability to grow earnings per share, but we like that the dividend payments have been fairly consistent. In summary, Fuller Smith & Turner has a number of shortcomings that we'd find it hard to get past. Things could change, but we think there are likely more attractive alternatives out there.
Without at least some growth in earnings per share over time, the dividend will eventually come under pressure either from costs or inflation. Very few businesses see earnings consistently shrink year after year in perpetuity though, and so it might be worth seeing what the 6 analysts we track are forecasting for the future.
We have also put together a list of global stocks with a market capitalisation above $1bn and yielding more 3%.
We aim to bring you long-term focused research analysis driven by fundamental data. Note that our analysis may not factor in the latest price-sensitive company announcements or qualitative material.
If you spot an error that warrants correction, please contact the editor at editorial-team@simplywallst.com. This article by Simply Wall St is general in nature. It does not constitute a recommendation to buy or sell any stock, and does not take account of your objectives, or your financial situation. Simply Wall St has no position in the stocks mentioned. Thank you for reading.
