
 Yahoo Finance
 Can Continental Aktiengesellschaft (FRA:CON) Maintain Its Strong Returns?

While some investors are already well versed in financial metrics (hat tip), this article is for those who would like to learn about Return On Equity (ROE) and why it is important. To keep the lesson grounded in practicality, we’ll use ROE to better understand Continental Aktiengesellschaft (FRA:CON).
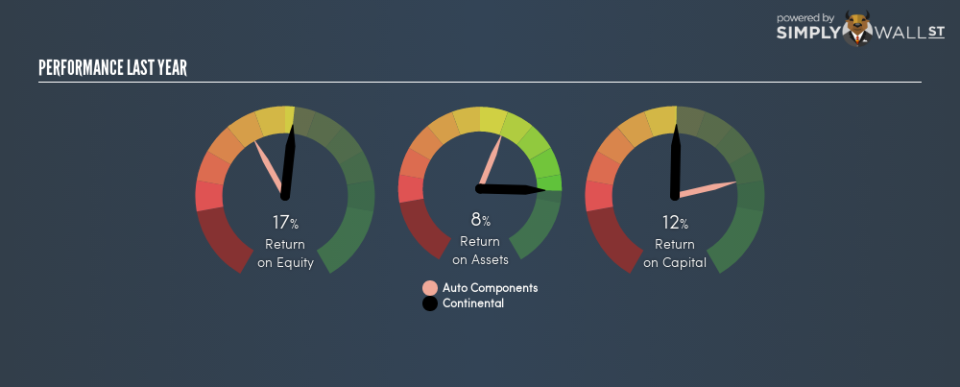
Our data shows Continental has a return on equity of 17% for the last year. One way to conceptualize this, is that for each €1 of shareholders’ equity it has, the company made €0.17 in profit.
See our latest analysis for Continental
How Do You Calculate ROE?
The formula for return on equity is:
Return on Equity = Net Profit ÷ Shareholders’ Equity
Or for Continental:
17% = 2946.3 ÷ €18b (Based on the trailing twelve months to September 2018.)
It’s easy to understand the ‘net profit’ part of that equation, but ‘shareholders’ equity’ requires further explanation. It is the capital paid in by shareholders, plus any retained earnings. Shareholders’ equity can be calculated by subtracting the total liabilities of the company from the total assets of the company.
What Does ROE Signify?
ROE measures a company’s profitability against the profit it retains, and any outside investments. The ‘return’ is the yearly profit. A higher profit will lead to a higher ROE. So, all else equal, investors should like a high ROE. That means it can be interesting to compare the ROE of different companies.
Does Continental Have A Good ROE?
By comparing a company’s ROE with its industry average, we can get a quick measure of how good it is. The limitation of this approach is that some companies are quite different from others, even within the same industry classification. As is clear from the image below, Continental has a better ROE than the average (11%) in the Auto Components industry.
That’s what I like to see. I usually take a closer look when a company has a better ROE than industry peers. One data point to check is if insiders have bought shares recently.
Why You Should Consider Debt When Looking At ROE
Virtually all companies need money to invest in the business, to grow profits. The cash for investment can come from prior year profits (retained earnings), issuing new shares, or borrowing. In the first and second cases, the ROE will reflect this use of cash for investment in the business. In the latter case, the debt used for growth will improve returns, but won’t affect the total equity. In this manner the use of debt will boost ROE, even though the core economics of the business stay the same.
Combining Continental’s Debt And Its 17% Return On Equity
Continental has a debt to equity ratio of 0.27, which is far from excessive. Its very respectable ROE, combined with only modest debt, suggests the business is in good shape. Careful use of debt to boost returns is often very good for shareholders. However, it could reduce the company’s ability to take advantage of future opportunities.
The Key Takeaway
Return on equity is useful for comparing the quality of different businesses. Companies that can achieve high returns on equity without too much debt are generally of good quality. If two companies have the same ROE, then I would generally prefer the one with less debt.
Having said that, while ROE is a useful indicator of business quality, you’ll have to look at a whole range of factors to determine the right price to buy a stock. The rate at which profits are likely to grow, relative to the expectations of profit growth reflected in the current price, must be considered, too. So you might want to check this FREE visualization of analyst forecasts for the company.
Of course, you might find a fantastic investment by looking elsewhere. So take a peek at this free list of interesting companies.
To help readers see past the short term volatility of the financial market, we aim to bring you a long-term focused research analysis purely driven by fundamental data. Note that our analysis does not factor in the latest price-sensitive company announcements.
The author is an independent contributor and at the time of publication had no position in the stocks mentioned. For errors that warrant correction please contact the editor at editorial-team@simplywallst.com.
