
 Yahoo Finance
 Is Coral Products plc’s (LON:CRU) Balance Sheet Strong Enough To Weather A Storm?

Coral Products plc (LON:CRU) is a small-cap stock with a market capitalization of UK£9.5m. While investors primarily focus on the growth potential and competitive landscape of the small-cap companies, they end up ignoring a key aspect, which could be the biggest threat to its existence: its financial health. Why is it important? Evaluating financial health as part of your investment thesis is essential, since poor capital management may bring about bankruptcies, which occur at a higher rate for small-caps. I believe these basic checks tell most of the story you need to know. Though, I know these factors are very high-level, so I’d encourage you to dig deeper yourself into CRU here.
How much cash does CRU generate through its operations?
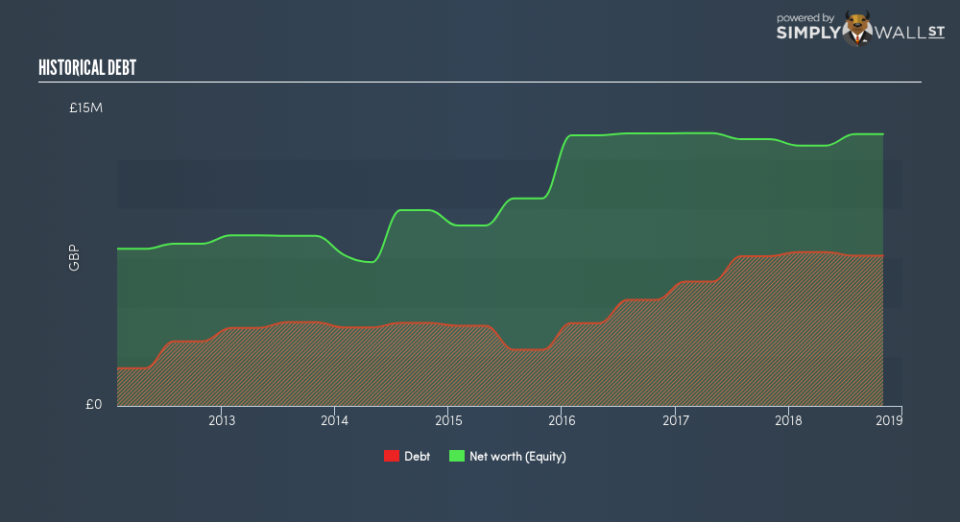
CRU has sustained its debt level by about UK£7.6m over the last 12 months which accounts for long term debt. At this constant level of debt, CRU’s cash and short-term investments stands at UK£727k , ready to deploy into the business. Additionally, CRU has generated UK£2.2m in operating cash flow in the last twelve months, resulting in an operating cash to total debt ratio of 28%, indicating that CRU’s operating cash is sufficient to cover its debt. This ratio can also be interpreted as a measure of efficiency as an alternative to return on assets. In CRU’s case, it is able to generate 0.28x cash from its debt capital.
Can CRU meet its short-term obligations with the cash in hand?
With current liabilities at UK£9.1m, it appears that the company has been able to meet these obligations given the level of current assets of UK£10m, with a current ratio of 1.1x. Generally, for Packaging companies, this is a reasonable ratio since there’s a sufficient cash cushion without leaving too much capital idle or in low-earning investments.
Can CRU service its debt comfortably?
CRU is a relatively highly levered company with a debt-to-equity of 55%. This is not uncommon for a small-cap company given that debt tends to be lower-cost and at times, more accessible. We can check to see whether CRU is able to meet its debt obligations by looking at the net interest coverage ratio. A company generating earnings before interest and tax (EBIT) at least three times its net interest payments is considered financially sound. In CRU’s, case, the ratio of 2.72x suggests that interest is not strongly covered, which means that lenders may be more reluctant to lend out more funding as CRU’s low interest coverage already puts the company at higher risk of default.
Next Steps:
Although CRU’s debt level is towards the higher end of the spectrum, its cash flow coverage seems adequate to meet obligations which means its debt is being efficiently utilised. Since there is also no concerns around CRU’s liquidity needs, this may be its optimal capital structure for the time being. I admit this is a fairly basic analysis for CRU’s financial health. Other important fundamentals need to be considered alongside. I suggest you continue to research Coral Products to get a better picture of the small-cap by looking at:
Future Outlook: What are well-informed industry analysts predicting for CRU’s future growth? Take a look at our free research report of analyst consensus for CRU’s outlook.
Valuation: What is CRU worth today? Is the stock undervalued, even when its growth outlook is factored into its intrinsic value? The intrinsic value infographic in our free research report helps visualize whether CRU is currently mispriced by the market.
Other High-Performing Stocks: Are there other stocks that provide better prospects with proven track records? Explore our free list of these great stocks here.
To help readers see past the short term volatility of the financial market, we aim to bring you a long-term focused research analysis purely driven by fundamental data. Note that our analysis does not factor in the latest price-sensitive company announcements.
The author is an independent contributor and at the time of publication had no position in the stocks mentioned. For errors that warrant correction please contact the editor at editorial-team@simplywallst.com.
