
 Yahoo Finance
 Cordlife Group (SGX:P8A) Could Be At Risk Of Shrinking As A Company
What underlying fundamental trends can indicate that a company might be in decline? Businesses in decline often have two underlying trends, firstly, a declining return on capital employed (ROCE) and a declining base of capital employed. Basically the company is earning less on its investments and it is also reducing its total assets. So after we looked into Cordlife Group (SGX:P8A), the trends above didn't look too great.
What Is Return On Capital Employed (ROCE)?
For those who don't know, ROCE is a measure of a company's yearly pre-tax profit (its return), relative to the capital employed in the business. To calculate this metric for Cordlife Group, this is the formula:
Return on Capital Employed = Earnings Before Interest and Tax (EBIT) ÷ (Total Assets - Current Liabilities)
0.0048 = S$1.0m ÷ (S$234m - S$24m) (Based on the trailing twelve months to June 2023).
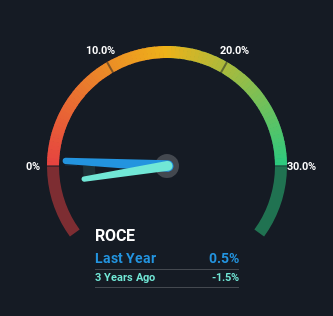
So, Cordlife Group has an ROCE of 0.5%. In absolute terms, that's a low return and it also under-performs the Healthcare industry average of 8.6%.
See our latest analysis for Cordlife Group
While the past is not representative of the future, it can be helpful to know how a company has performed historically, which is why we have this chart above. If you'd like to look at how Cordlife Group has performed in the past in other metrics, you can view this free graph of past earnings, revenue and cash flow.
How Are Returns Trending?
In terms of Cordlife Group's historical ROCE movements, the trend doesn't inspire confidence. To be more specific, the ROCE was 1.8% five years ago, but since then it has dropped noticeably. Meanwhile, capital employed in the business has stayed roughly the flat over the period. Companies that exhibit these attributes tend to not be shrinking, but they can be mature and facing pressure on their margins from competition. If these trends continue, we wouldn't expect Cordlife Group to turn into a multi-bagger.
The Key Takeaway
In the end, the trend of lower returns on the same amount of capital isn't typically an indication that we're looking at a growth stock. In spite of that, the stock has delivered a 23% return to shareholders who held over the last five years. Either way, we aren't huge fans of the current trends and so with that we think you might find better investments elsewhere.
On a separate note, we've found 3 warning signs for Cordlife Group you'll probably want to know about.
While Cordlife Group may not currently earn the highest returns, we've compiled a list of companies that currently earn more than 25% return on equity. Check out this free list here.
Have feedback on this article? Concerned about the content? Get in touch with us directly. Alternatively, email editorial-team (at) simplywallst.com.
This article by Simply Wall St is general in nature. We provide commentary based on historical data and analyst forecasts only using an unbiased methodology and our articles are not intended to be financial advice. It does not constitute a recommendation to buy or sell any stock, and does not take account of your objectives, or your financial situation. We aim to bring you long-term focused analysis driven by fundamental data. Note that our analysis may not factor in the latest price-sensitive company announcements or qualitative material. Simply Wall St has no position in any stocks mentioned.
