
 Yahoo Finance
 Core Laboratories (NYSE:CLB) sheds US$51m, company earnings and investor returns have been trending downwards for past five years
We're definitely into long term investing, but some companies are simply bad investments over any time frame. We really hate to see fellow investors lose their hard-earned money. Spare a thought for those who held Core Laboratories Inc. (NYSE:CLB) for five whole years - as the share price tanked 83%. Shareholders have had an even rougher run lately, with the share price down 18% in the last 90 days. We note that the company has reported results fairly recently; and the market is hardly delighted. You can check out the latest numbers in our company report. We really feel for shareholders in this scenario. It's a good reminder of the importance of diversification, and it's worth keeping in mind there's more to life than money, anyway.
If the past week is anything to go by, investor sentiment for Core Laboratories isn't positive, so let's see if there's a mismatch between fundamentals and the share price.
Check out our latest analysis for Core Laboratories
While markets are a powerful pricing mechanism, share prices reflect investor sentiment, not just underlying business performance. One flawed but reasonable way to assess how sentiment around a company has changed is to compare the earnings per share (EPS) with the share price.
During five years of share price growth, Core Laboratories moved from a loss to profitability. That would generally be considered a positive, so we are surprised to see the share price is down. Other metrics might give us a better handle on how its value is changing over time.
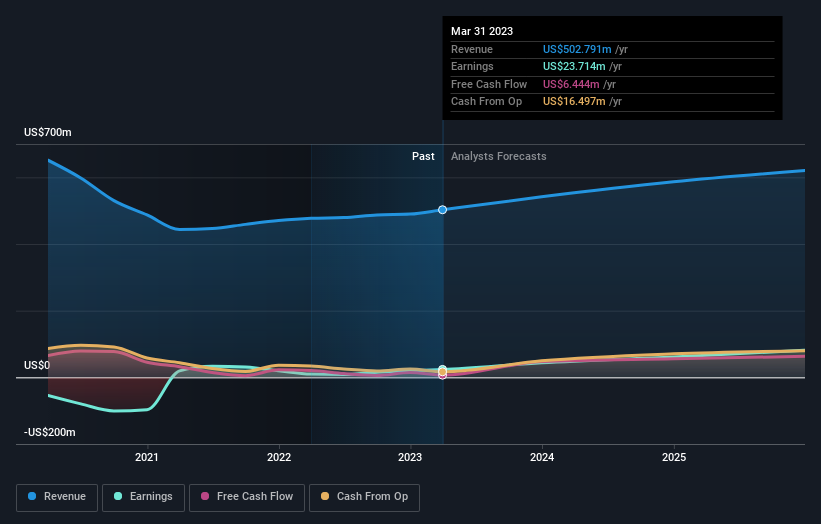
We don't think that the 0.2% is big factor in the share price, since it's quite small, as dividends go. Arguably, the revenue drop of 10% a year for half a decade suggests that the company can't grow in the long term. That could explain the weak share price.
You can see below how earnings and revenue have changed over time (discover the exact values by clicking on the image).
We know that Core Laboratories has improved its bottom line over the last three years, but what does the future have in store? You can see how its balance sheet has strengthened (or weakened) over time in this free interactive graphic.
A Different Perspective
While the broader market lost about 2.5% in the twelve months, Core Laboratories shareholders did even worse, losing 17% (even including dividends). However, it could simply be that the share price has been impacted by broader market jitters. It might be worth keeping an eye on the fundamentals, in case there's a good opportunity. Unfortunately, longer term shareholders are suffering worse, given the loss of 13% doled out over the last five years. We'd need to see some sustained improvements in the key metrics before we could muster much enthusiasm. I find it very interesting to look at share price over the long term as a proxy for business performance. But to truly gain insight, we need to consider other information, too. For example, we've discovered 1 warning sign for Core Laboratories that you should be aware of before investing here.
Of course Core Laboratories may not be the best stock to buy. So you may wish to see this free collection of growth stocks.
Please note, the market returns quoted in this article reflect the market weighted average returns of stocks that currently trade on American exchanges.
Have feedback on this article? Concerned about the content? Get in touch with us directly. Alternatively, email editorial-team (at) simplywallst.com.
This article by Simply Wall St is general in nature. We provide commentary based on historical data and analyst forecasts only using an unbiased methodology and our articles are not intended to be financial advice. It does not constitute a recommendation to buy or sell any stock, and does not take account of your objectives, or your financial situation. We aim to bring you long-term focused analysis driven by fundamental data. Note that our analysis may not factor in the latest price-sensitive company announcements or qualitative material. Simply Wall St has no position in any stocks mentioned.
Join A Paid User Research Session
You’ll receive a US$30 Amazon Gift card for 1 hour of your time while helping us build better investing tools for the individual investors like yourself. Sign up here
