
 Yahoo Finance
 Cosmo Pharmaceuticals (VTX:COPN) shareholders have endured a 58% loss from investing in the stock five years ago
Generally speaking long term investing is the way to go. But along the way some stocks are going to perform badly. Zooming in on an example, the Cosmo Pharmaceuticals N.V. (VTX:COPN) share price dropped 59% in the last half decade. That's an unpleasant experience for long term holders. The falls have accelerated recently, with the share price down 11% in the last three months. This could be related to the recent financial results - you can catch up on the most recent data by reading our company report.
So let's have a look and see if the longer term performance of the company has been in line with the underlying business' progress.
See our latest analysis for Cosmo Pharmaceuticals
In his essay The Superinvestors of Graham-and-Doddsville Warren Buffett described how share prices do not always rationally reflect the value of a business. By comparing earnings per share (EPS) and share price changes over time, we can get a feel for how investor attitudes to a company have morphed over time.
During five years of share price growth, Cosmo Pharmaceuticals moved from a loss to profitability. Most would consider that to be a good thing, so it's counter-intuitive to see the share price declining. Other metrics may better explain the share price move.
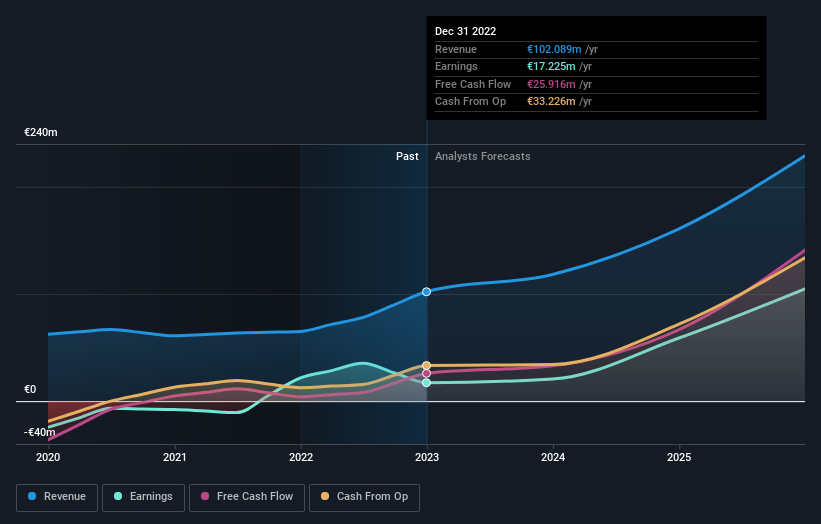
We don't think that the 1.9% is big factor in the share price, since it's quite small, as dividends go. In contrast to the share price, revenue has actually increased by 5.2% a year in the five year period. A more detailed examination of the revenue and earnings may or may not explain why the share price languishes; there could be an opportunity.
You can see below how earnings and revenue have changed over time (discover the exact values by clicking on the image).
It is of course excellent to see how Cosmo Pharmaceuticals has grown profits over the years, but the future is more important for shareholders. This free interactive report on Cosmo Pharmaceuticals' balance sheet strength is a great place to start, if you want to investigate the stock further.
A Different Perspective
The total return of 7.0% received by Cosmo Pharmaceuticals shareholders over the last year isn't far from the market return of -6.6%. However, the loss over the last year isn't as bad as the 10% per annum loss investors have suffered over the last half decade. Generally speaking we'd prefer see an improvement in the fundamental metrics before becoming enthusiastic about the stock. While it is well worth considering the different impacts that market conditions can have on the share price, there are other factors that are even more important. Take risks, for example - Cosmo Pharmaceuticals has 2 warning signs we think you should be aware of.
Of course Cosmo Pharmaceuticals may not be the best stock to buy. So you may wish to see this free collection of growth stocks.
Please note, the market returns quoted in this article reflect the market weighted average returns of stocks that currently trade on Swiss exchanges.
Have feedback on this article? Concerned about the content? Get in touch with us directly. Alternatively, email editorial-team (at) simplywallst.com.
This article by Simply Wall St is general in nature. We provide commentary based on historical data and analyst forecasts only using an unbiased methodology and our articles are not intended to be financial advice. It does not constitute a recommendation to buy or sell any stock, and does not take account of your objectives, or your financial situation. We aim to bring you long-term focused analysis driven by fundamental data. Note that our analysis may not factor in the latest price-sensitive company announcements or qualitative material. Simply Wall St has no position in any stocks mentioned.
Join A Paid User Research Session
You’ll receive a US$30 Amazon Gift card for 1 hour of your time while helping us build better investing tools for the individual investors like yourself. Sign up here
