
 Yahoo Finance
 Coterra Energy's (NYSE:CTRA) investors will be pleased with their respectable 75% return over the last three years
It hasn't been the best quarter for Coterra Energy Inc. (NYSE:CTRA) shareholders, since the share price has fallen 19% in that time. But don't let that distract from the very nice return generated over three years. In fact, the company's share price bested the return of its market index in that time, posting a gain of 48%.
So let's investigate and see if the longer term performance of the company has been in line with the underlying business' progress.
See our latest analysis for Coterra Energy
While markets are a powerful pricing mechanism, share prices reflect investor sentiment, not just underlying business performance. By comparing earnings per share (EPS) and share price changes over time, we can get a feel for how investor attitudes to a company have morphed over time.
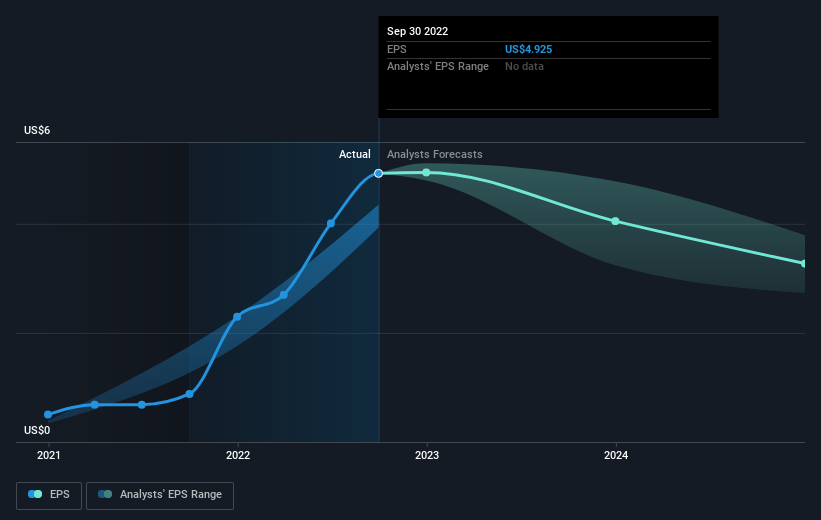
During three years of share price growth, Coterra Energy achieved compound earnings per share growth of 38% per year. The average annual share price increase of 14% is actually lower than the EPS growth. So it seems investors have become more cautious about the company, over time. This cautious sentiment is reflected in its (fairly low) P/E ratio of 4.96.
You can see how EPS has changed over time in the image below (click on the chart to see the exact values).
We consider it positive that insiders have made significant purchases in the last year. Even so, future earnings will be far more important to whether current shareholders make money. Dive deeper into the earnings by checking this interactive graph of Coterra Energy's earnings, revenue and cash flow.
What About Dividends?
As well as measuring the share price return, investors should also consider the total shareholder return (TSR). Whereas the share price return only reflects the change in the share price, the TSR includes the value of dividends (assuming they were reinvested) and the benefit of any discounted capital raising or spin-off. Arguably, the TSR gives a more comprehensive picture of the return generated by a stock. As it happens, Coterra Energy's TSR for the last 3 years was 75%, which exceeds the share price return mentioned earlier. This is largely a result of its dividend payments!
A Different Perspective
We're pleased to report that Coterra Energy shareholders have received a total shareholder return of 34% over one year. That's including the dividend. That gain is better than the annual TSR over five years, which is 2%. Therefore it seems like sentiment around the company has been positive lately. Given the share price momentum remains strong, it might be worth taking a closer look at the stock, lest you miss an opportunity. While it is well worth considering the different impacts that market conditions can have on the share price, there are other factors that are even more important. For instance, we've identified 2 warning signs for Coterra Energy (1 is potentially serious) that you should be aware of.
Coterra Energy is not the only stock insiders are buying. So take a peek at this free list of growing companies with insider buying.
Please note, the market returns quoted in this article reflect the market weighted average returns of stocks that currently trade on US exchanges.
Have feedback on this article? Concerned about the content? Get in touch with us directly. Alternatively, email editorial-team (at) simplywallst.com.
This article by Simply Wall St is general in nature. We provide commentary based on historical data and analyst forecasts only using an unbiased methodology and our articles are not intended to be financial advice. It does not constitute a recommendation to buy or sell any stock, and does not take account of your objectives, or your financial situation. We aim to bring you long-term focused analysis driven by fundamental data. Note that our analysis may not factor in the latest price-sensitive company announcements or qualitative material. Simply Wall St has no position in any stocks mentioned.
Join A Paid User Research Session
You’ll receive a US$30 Amazon Gift card for 1 hour of your time while helping us build better investing tools for the individual investors like yourself. Sign up here
