
 Yahoo Finance
 Could The Grenke AG (ETR:GLJ) Ownership Structure Tell Us Something Useful?

The big shareholder groups in Grenke AG (ETR:GLJ) have power over the company. Institutions often own shares in more established companies, while it’s not unusual to see insiders own a fair bit of smaller companies. Warren Buffett said that he likes ‘a business with enduring competitive advantages that is run by able and owner-oriented people’. So it’s nice to see some insider ownership, because it may suggest that management is owner-oriented.
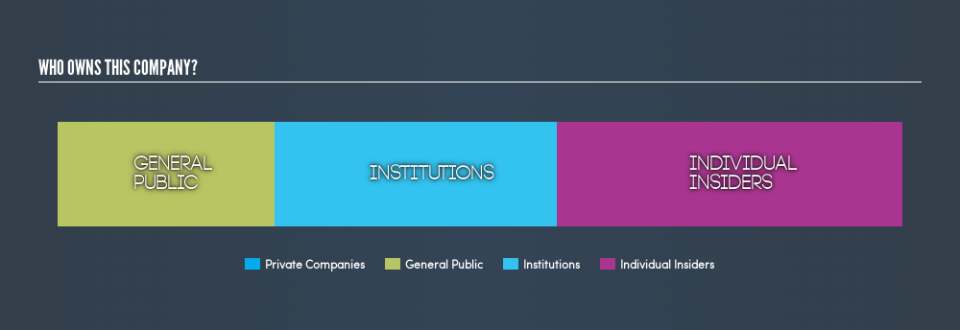
Grenke has a market capitalization of €4.2b, so it’s too big to fly under the radar. We’d expect to see both institutions and retail investors owning a portion of the company. In the chart below below, we can see that institutions are noticeable on the share registry. Let’s delve deeper into each type of owner, to discover more about GLJ.
View our latest analysis for Grenke
What Does The Institutional Ownership Tell Us About Grenke?
Institutional investors commonly compare their own returns to the returns of a commonly followed index. So they generally do consider buying larger companies that are included in the relevant benchmark index.
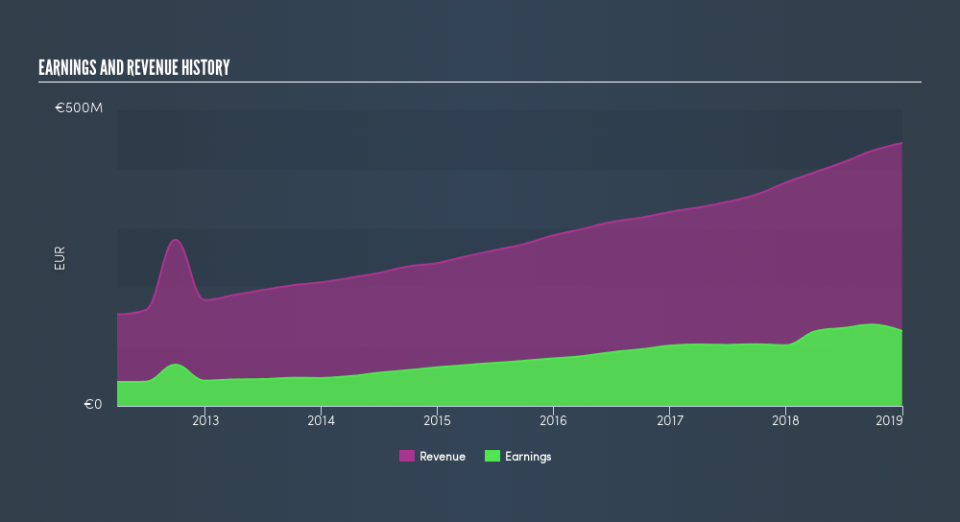
We can see that Grenke does have institutional investors; and they hold 33% of the stock. This suggests some credibility amongst professional investors. But we can’t rely on that fact alone, since institutions make bad investments sometimes, just like everyone does. When multiple institutions own a stock, there’s always a risk that they are in a ‘crowded trade’. When such a trade goes wrong, multiple parties may compete to sell stock fast. This risk is higher in a company without a history of growth. You can see Grenke’s historic earnings and revenue, below, but keep in mind there’s always more to the story.
Hedge funds don’t have many shares in Grenke. There are plenty of analysts covering the stock, so it might be worth seeing what they are forecasting, too.
Insider Ownership Of Grenke
The definition of company insiders can be subjective, and does vary between jurisdictions. Our data reflects individual insiders, capturing board members at the very least. Management ultimately answers to the board. However, it is not uncommon for managers to be executive board members, especially if they are a founder or the CEO.
Insider ownership is positive when it signals leadership are thinking like the true owners of the company. However, high insider ownership can also give immense power to a small group within the company. This can be negative in some circumstances.
Our most recent data indicates that insiders own a reasonable proportion of Grenke AG. It has a market capitalization of just €4.2b, and insiders have €1.7b worth of shares in their own names. That’s quite significant. Most would say this shows a good degree of alignment with shareholders, especially in a company of this size. You can click here to see if those insiders have been buying or selling.
General Public Ownership
With a 26% ownership, the general public have some degree of sway over GLJ. While this group can’t necessarily call the shots, it can certainly have a real influence on how the company is run.
Next Steps:
It’s always worth thinking about the different groups who own shares in a company. But to understand Grenke better, we need to consider many other factors.
Many find it useful to take an in depth look at how a company has performed in the past. You can access this detailed graph of past earnings, revenue and cash flow .
If you are like me, you may want to think about whether this company will grow or shrink. Luckily, you can check this free report showing analyst forecasts for its future.
NB: Figures in this article are calculated using data from the last twelve months, which refer to the 12-month period ending on the last date of the month the financial statement is dated. This may not be consistent with full year annual report figures.
We aim to bring you long-term focused research analysis driven by fundamental data. Note that our analysis may not factor in the latest price-sensitive company announcements or qualitative material.
If you spot an error that warrants correction, please contact the editor at editorial-team@simplywallst.com. This article by Simply Wall St is general in nature. It does not constitute a recommendation to buy or sell any stock, and does not take account of your objectives, or your financial situation. Simply Wall St has no position in the stocks mentioned. Thank you for reading.
