
 Yahoo Finance
 Could The Market Be Wrong About Serco Group plc (LON:SRP) Given Its Attractive Financial Prospects?
Serco Group (LON:SRP) has had a rough three months with its share price down 6.3%. However, stock prices are usually driven by a company’s financial performance over the long term, which in this case looks quite promising. Particularly, we will be paying attention to Serco Group's ROE today.
Return on Equity or ROE is a test of how effectively a company is growing its value and managing investors’ money. Simply put, it is used to assess the profitability of a company in relation to its equity capital.
Check out our latest analysis for Serco Group
How To Calculate Return On Equity?
ROE can be calculated by using the formula:
Return on Equity = Net Profit (from continuing operations) ÷ Shareholders' Equity
So, based on the above formula, the ROE for Serco Group is:
18% = UK£122m ÷ UK£683m (Based on the trailing twelve months to June 2020).
The 'return' is the profit over the last twelve months. Another way to think of that is that for every £1 worth of equity, the company was able to earn £0.18 in profit.
Why Is ROE Important For Earnings Growth?
So far, we've learned that ROE is a measure of a company's profitability. Based on how much of its profits the company chooses to reinvest or "retain", we are then able to evaluate a company's future ability to generate profits. Assuming everything else remains unchanged, the higher the ROE and profit retention, the higher the growth rate of a company compared to companies that don't necessarily bear these characteristics.
Serco Group's Earnings Growth And 18% ROE
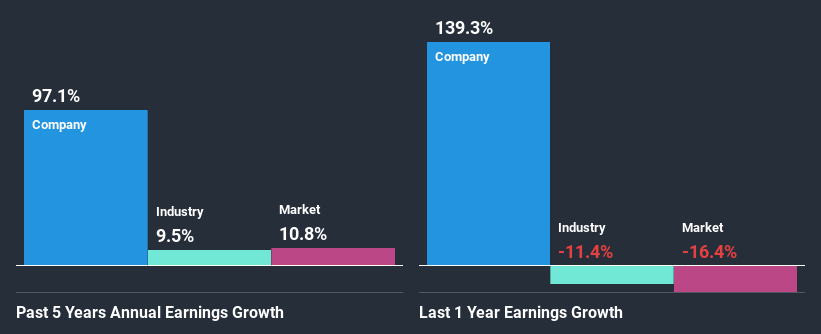
To begin with, Serco Group seems to have a respectable ROE. Further, the company's ROE compares quite favorably to the industry average of 10%. This certainly adds some context to Serco Group's exceptional 97% net income growth seen over the past five years. We believe that there might also be other aspects that are positively influencing the company's earnings growth. Such as - high earnings retention or an efficient management in place.
Next, on comparing with the industry net income growth, we found that Serco Group's growth is quite high when compared to the industry average growth of 9.5% in the same period, which is great to see.
The basis for attaching value to a company is, to a great extent, tied to its earnings growth. It’s important for an investor to know whether the market has priced in the company's expected earnings growth (or decline). By doing so, they will have an idea if the stock is headed into clear blue waters or if swampy waters await. What is SRP worth today? The intrinsic value infographic in our free research report helps visualize whether SRP is currently mispriced by the market.
Is Serco Group Making Efficient Use Of Its Profits?
Given that Serco Group doesn't pay any dividend to its shareholders, we infer that the company has been reinvesting all of its profits to grow its business.
Summary
In total, we are pretty happy with Serco Group's performance. Specifically, we like that the company is reinvesting a huge chunk of its profits at a high rate of return. This of course has caused the company to see substantial growth in its earnings. With that said, on studying the latest analyst forecasts, we found that while the company has seen growth in its past earnings, analysts expect its future earnings to shrink. To know more about the company's future earnings growth forecasts take a look at this free report on analyst forecasts for the company to find out more.
This article by Simply Wall St is general in nature. It does not constitute a recommendation to buy or sell any stock, and does not take account of your objectives, or your financial situation. We aim to bring you long-term focused analysis driven by fundamental data. Note that our analysis may not factor in the latest price-sensitive company announcements or qualitative material. Simply Wall St has no position in any stocks mentioned.
Have feedback on this article? Concerned about the content? Get in touch with us directly. Alternatively, email editorial-team (at) simplywallst.com.
