
 Yahoo Finance
 The UK economy in 2020 in five charts
2020 has been a year like no other for the UK economy, as a public health crisis quickly spiralled into a social and economic crisis that has wreaked havoc for firms and jobs.
Figures from the Office for Budget Responsibility (OBR) suggest economic output will end the year 11.3% lower than the previous year, marking the biggest decline in GDP in more than three centuries.
Here we take a look at some of the most eye-catching charts on the economy’s fate over the past year, capturing just a few of the countless repercussions of COVID-19 on lives and livelihoods.
The spread of the virus
Any account of the UK economy in 2020 inevitably starts with the course of the coronavirus itself, which has repeatedly forced seismic changes on the entire population.
The virus quickly spread around the world after it was first reported by officials in Wuhan, China, in December last year. Tens of millions of cases and more than a million deaths have been reported worldwide, including tens of thousands of deaths in the UK.
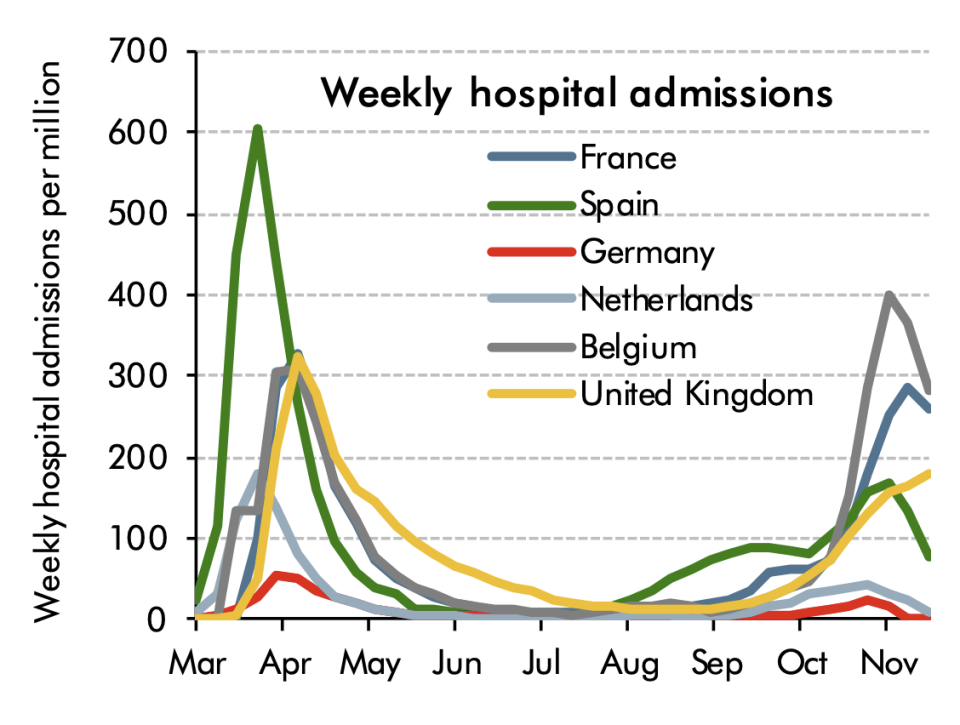
This chart by the OBR shows how severe cases requiring hospital admission skyrocketed as it reached Europe, before receding after countries imposed lockdowns. Admissions escalated again after lockdowns were eased, forcing a second round of tighter restrictions to curb its spread once more.
This has led to a bulk of Britain entering Tier 4 — the most severe of restrictions — ahead of the Christmas period due to a new strain of coronavirus being discovered.
Everyday life grinding to a halt
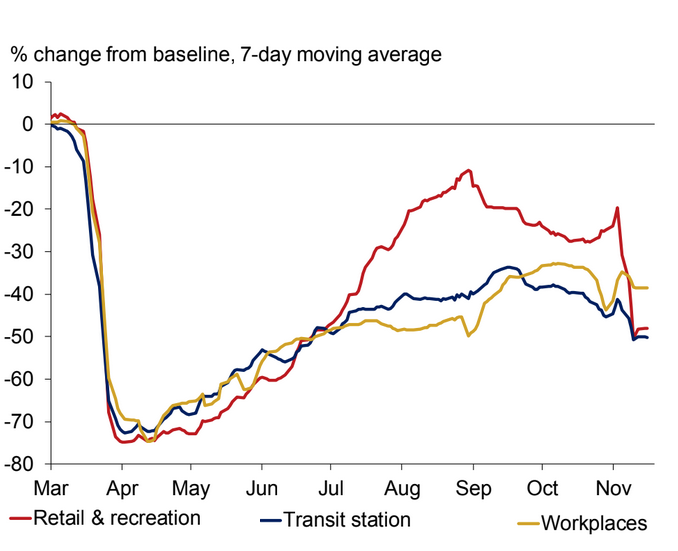
Policymakers and economists have spent much of the year pouring over not only grim daily infection and death figures, but also Google (GOOG) and Apple (AAPL) device data on movement.
Google began releasing anonymised mobility data from users’ devices globally after the pandemic hit, saying it had been encouraged by public health officials.
They illustrate starkly how much the virus has affected everyday economic life, and have provided near-real-time insights into how significantly government restrictions have curbed activity.
The above chart shows how travel to identified retail and recreation locations, stations and workplaces collapsed in the first UK lockdown, recovered in the summer before stalling as infection levels and restrictions increased.
Redundancies rising at record pace
Livelihoods in many sectors have taken a heavy blow this year, from both COVID-19 and government restrictions to tackle it that are without parallel in modern peacetime history in Britain.
Travel, leisure, hospitality and much of retail have been among the hardest hit by virus fears and curbs including total lockdowns. Almost a third of the entire UK workforce were on the government-subsidised job protection scheme earlier this year, but the scale of the crisis has forced widespread cuts to roles, pay, hours and recruitment.
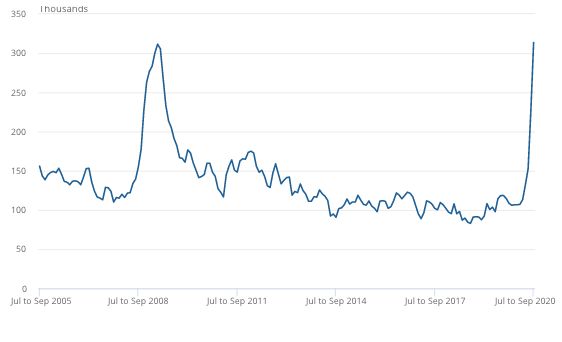
Official figures show UK redundancies both soared at the fastest pace and reached the highest level on record earlier this year. As this chart shows, 314,000 redundancies were formally reported between July and September alone, narrowly exceeding the worst of the global financial crisis just over a decade ago.
Highest government borrowing in peacetime history
NHS, job support and other crisis measures have pushed UK government spending up by £280bn this year, while the economy and tax receipts have taken a heavy hit.
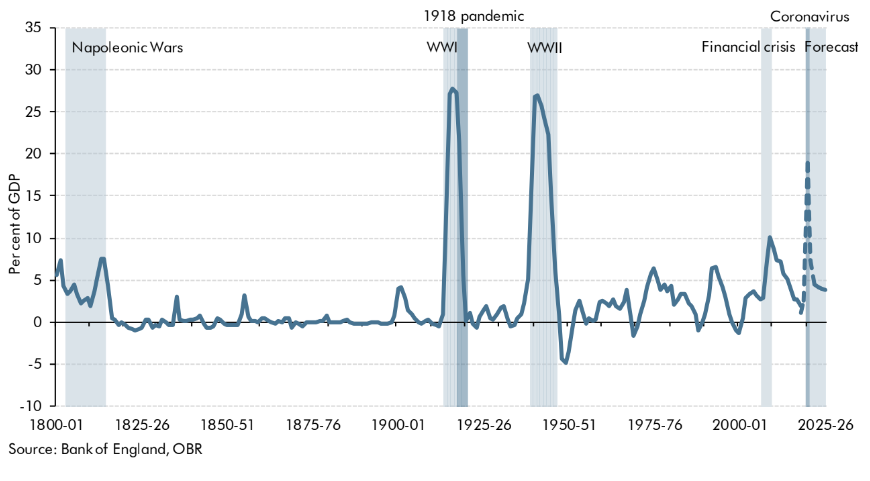
Public borrowing to plug the gap is set to be the highest in peacetime history this year at 19% of GDP, according to the latest OBR figures. Official data suggests only two world wars forced the Treasury to borrow more in the past two centuries.
Government borrowing costs remain ultra-low, and recovery should reduce much of the deficit. But economists expect some permanent economic ‘scarring,’ leaving a persistent budget gap that has already sparked debate over tax hikes or spending cuts.
Market meltdown and recovery
Global financial markets were thrown into chaos in March, as investors took fright over the potential scale of the economic damage the coronavirus and restrictions could wreak.
The sell-off saw billions wiped off the value of Britain’s 100 biggest listed companies, with the steepest quarterly decline on the FTSE (^FTSE) index since 1987.
The market meltdown including UK bond yields and benchmark US oil prices turning negative for the first time. Investors effectively paid to hold their cash as ‘safe haven’ government debt, and paid buyers to take crude (CL=F) off their hands as a glut risked overwhelming storage facilities.
But major UK, European and US indices gradually recovered after wide-ranging interventions by central banks and governments. Leading indices took less of a hit from resurgent cases and curbs later in the year, and surged after vaccine breakthroughs in November.
However stocks and the pound took a fresh hit in late December as a new strain of coronavirus discovered in Britain led to the UK government placing 18 million citizens into a new ‘Tier 4’ strict lockdown. It led to over 40 countries across the world to ban flights from the UK, isolating the country and hurting its economy.
