
 Yahoo Finance
 CPPGroup (LON:CPP) Is Doing The Right Things To Multiply Its Share Price
If we want to find a stock that could multiply over the long term, what are the underlying trends we should look for? In a perfect world, we'd like to see a company investing more capital into its business and ideally the returns earned from that capital are also increasing. If you see this, it typically means it's a company with a great business model and plenty of profitable reinvestment opportunities. Speaking of which, we noticed some great changes in CPPGroup's (LON:CPP) returns on capital, so let's have a look.
Understanding Return On Capital Employed (ROCE)
If you haven't worked with ROCE before, it measures the 'return' (pre-tax profit) a company generates from capital employed in its business. Analysts use this formula to calculate it for CPPGroup:
Return on Capital Employed = Earnings Before Interest and Tax (EBIT) ÷ (Total Assets - Current Liabilities)
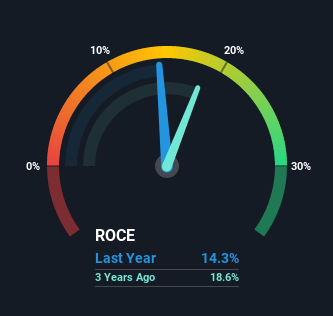
0.14 = UK£3.0m ÷ (UK£49m - UK£28m) (Based on the trailing twelve months to June 2021).
Therefore, CPPGroup has an ROCE of 14%. In absolute terms, that's a satisfactory return, but compared to the Commercial Services industry average of 11% it's much better.
Check out our latest analysis for CPPGroup
In the above chart we have measured CPPGroup's prior ROCE against its prior performance, but the future is arguably more important. If you'd like to see what analysts are forecasting going forward, you should check out our free report for CPPGroup.
What Can We Tell From CPPGroup's ROCE Trend?
The fact that CPPGroup is now generating some pre-tax profits from its prior investments is very encouraging. Shareholders would no doubt be pleased with this because the business was loss-making five years ago but is is now generating 14% on its capital. Not only that, but the company is utilizing 37% more capital than before, but that's to be expected from a company trying to break into profitability. This can indicate that there's plenty of opportunities to invest capital internally and at ever higher rates, both common traits of a multi-bagger.
One more thing to note, CPPGroup has decreased current liabilities to 57% of total assets over this period, which effectively reduces the amount of funding from suppliers or short-term creditors. This tells us that CPPGroup has grown its returns without a reliance on increasing their current liabilities, which we're very happy with. However, current liabilities are still at a pretty high level, so just be aware that this can bring with it some risks.
In Conclusion...
To the delight of most shareholders, CPPGroup has now broken into profitability. Although the company may be facing some issues elsewhere since the stock has plunged 76% in the last five years. Still, it's worth doing some further research to see if the trends will continue into the future.
If you want to know some of the risks facing CPPGroup we've found 5 warning signs (1 is concerning!) that you should be aware of before investing here.
For those who like to invest in solid companies, check out this free list of companies with solid balance sheets and high returns on equity.
Have feedback on this article? Concerned about the content? Get in touch with us directly. Alternatively, email editorial-team (at) simplywallst.com.
This article by Simply Wall St is general in nature. We provide commentary based on historical data and analyst forecasts only using an unbiased methodology and our articles are not intended to be financial advice. It does not constitute a recommendation to buy or sell any stock, and does not take account of your objectives, or your financial situation. We aim to bring you long-term focused analysis driven by fundamental data. Note that our analysis may not factor in the latest price-sensitive company announcements or qualitative material. Simply Wall St has no position in any stocks mentioned.
