
 Yahoo Finance
 Croda International PLC's Dividend Analysis
Delving into Croda International PLC's Dividend Sustainability and Prospects
Croda International PLC (COIHY) recently announced a dividend of $0.4 per share, payable on 2024-06-13, with the ex-dividend date set for 2024-04-18. As investors look forward to this upcoming payment, the spotlight also shines on the company's dividend history, yield, and growth rates. Using the data from GuruFocus, let's look into Croda International PLC's dividend performance and assess its sustainability.
What Does Croda International PLC Do?
This Powerful Chart Made Peter Lynch 29% A Year For 13 Years
How to calculate the intrinsic value of a stock?
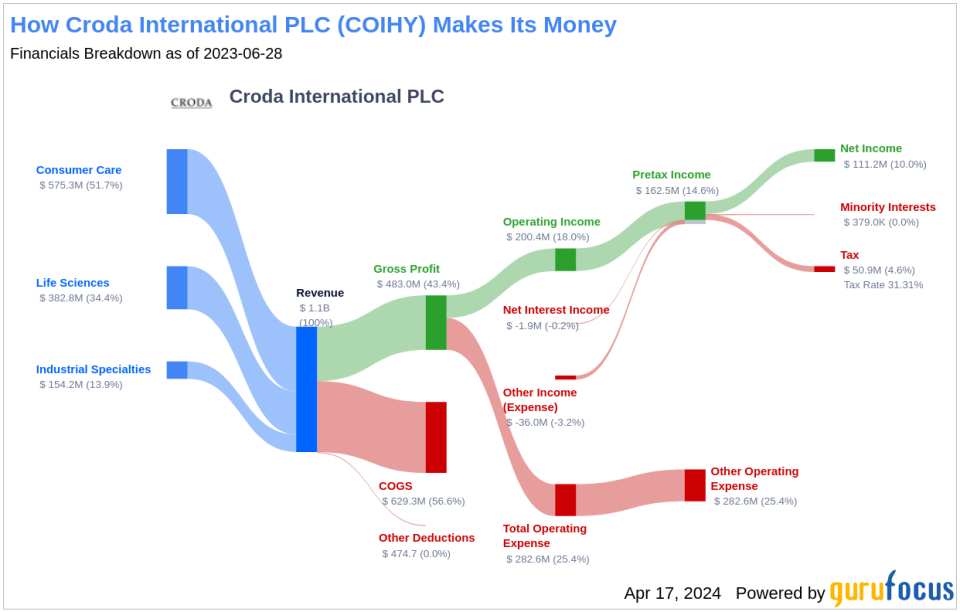
Croda is a British specialty chemicals company with 60% of sales outside Europe. Croda operates through three segments: consumer care, life sciences, and industrial specialties. Consumer care produces specialty and active ingredients for cosmetics and skincare/haircare and also flavors and fragrances. The life sciences business manufactures products for healthcare and agrochemicals. The company sold the majority of its industrial businesses to Cargill in 2022, retaining only a subsegment of the business (housed under the industrial specialties segment) that supports the other two segments and sells their byproducts.
A Glimpse at Croda International PLC's Dividend History
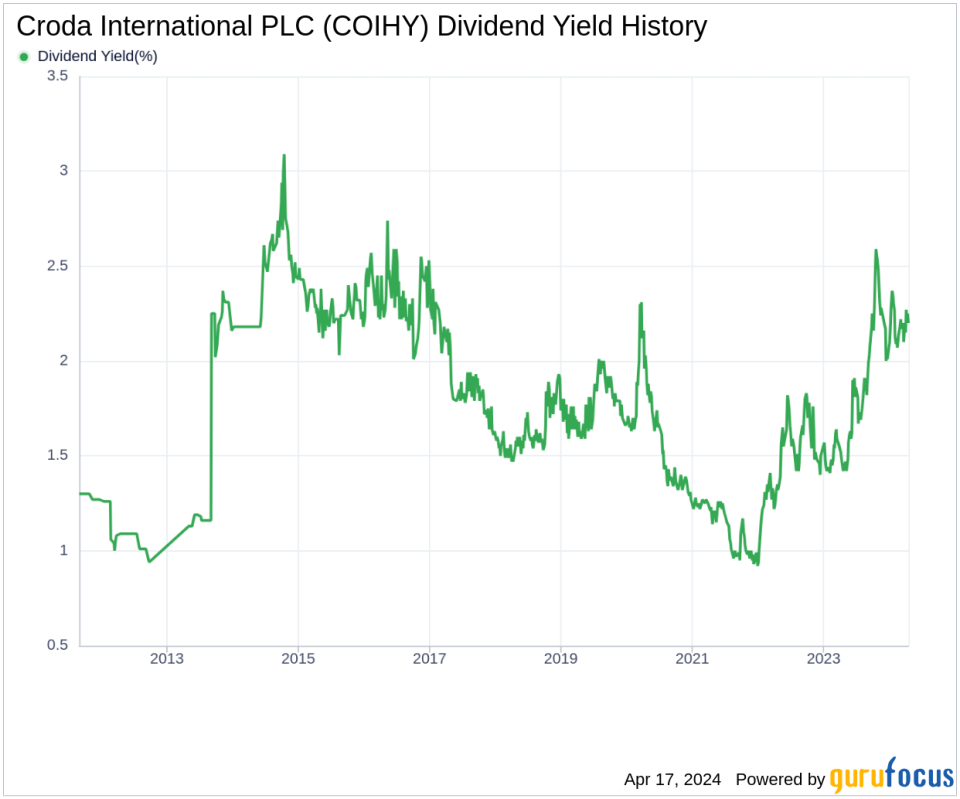
Croda International PLC has maintained a consistent dividend payment record since 2013. Dividends are currently distributed on a bi-annual basis. Below is a chart showing annual Dividends Per Share for tracking historical trends.
Breaking Down Croda International PLC's Dividend Yield and Growth
As of today, Croda International PLC currently has a 12-month trailing dividend yield of 2.20% and a 12-month forward dividend yield of 2.26%. This suggests an expectation of increased dividend payments over the next 12 months. Over the past three years, Croda International PLC's annual dividend growth rate was 6.30%. Extended to a five-year horizon, this rate decreased to 4.70% per year. And over the past decade, Croda International PLC's annual dividends per share growth rate stands at 5.20%.
Based on Croda International PLC's dividend yield and five-year growth rate, the 5-year yield on cost of Croda International PLC stock as of today is approximately 2.77%.
The Sustainability Question: Payout Ratio and Profitability
To assess the sustainability of the dividend, one needs to evaluate the company's payout ratio. The dividend payout ratio provides insights into the portion of earnings the company distributes as dividends. A lower ratio suggests that the company retains a significant part of its earnings, thereby ensuring the availability of funds for future growth and unexpected downturns. As of 2023-12-31, Croda International PLC's dividend payout ratio is 0.62.
Croda International PLC's profitability rank, offers an understanding of the company's earnings prowess relative to its peers. GuruFocus ranks Croda International PLC's profitability 8 out of 10 as of 2023-12-31, suggesting good profitability prospects. The company has reported positive net income for each of year over the past decade, further solidifying its high profitability.
Growth Metrics: The Future Outlook
To ensure the sustainability of dividends, a company must have robust growth metrics. Croda International PLC's growth rank of 8 out of 10 suggests that the company's growth trajectory is good relative to its competitors. Croda International PLC's revenue has increased by approximately 4.30% per year on average, a rate that underperforms approximately 66.37% of global competitors. The company's 3-year EPS growth rate showcases its capability to grow its earnings, a critical component for sustaining dividends in the long run. During the past three years, Croda International PLC's earnings increased by approximately -1.50% per year on average, a rate that underperforms approximately 65.08% of global competitors. Lastly, the company's 5-year EBITDA growth rate of 2.60%, which underperforms approximately 66% of global competitors.
Engaging Conclusion
In conclusion, Croda International PLC's dividend payments, dividend growth rate, payout ratio, profitability, and growth metrics paint a comprehensive picture of the company's financial health and potential for future dividend sustainability. With a solid track record of profitability and a reasonable payout ratio, Croda International PLC appears positioned to continue rewarding shareholders with dividends. However, investors should also consider the company's underperformance in growth metrics relative to its peers when assessing the long-term prospects of their investment. Will Croda International PLC's strategic initiatives and market position enable it to overcome these growth challenges and continue its dividend legacy? This question remains at the forefront for value investors seeking informed financial decisions. GuruFocus Premium users can screen for high-dividend yield stocks using the High Dividend Yield Screener.
This article, generated by GuruFocus, is designed to provide general insights and is not tailored financial advice. Our commentary is rooted in historical data and analyst projections, utilizing an impartial methodology, and is not intended to serve as specific investment guidance. It does not formulate a recommendation to purchase or divest any stock and does not consider individual investment objectives or financial circumstances. Our objective is to deliver long-term, fundamental data-driven analysis. Be aware that our analysis might not incorporate the most recent, price-sensitive company announcements or qualitative information. GuruFocus holds no position in the stocks mentioned herein.
This article first appeared on GuruFocus.
