
 Yahoo Finance
 Crude Oil Price Update – Bearish API Report Should Crush the Market
U.S. West Texas Intermediate crude oil futures are trading sharply lower as we approach the release of the American Petroleum Institute (API) weekly inventories report. Given that traders are primarily focused on concerns over the spread of the coronavirus, I don’t expect the report to have much of an influence on price unless it comes in well above expectations.
At 21:12 GMT, April WTI Crude Oil is trading $49.80, down $1.63 or -3.17%.
Additionally, traders showed little reaction to possible OPEC output cuts and Libyan supply losses so I suspect that a surprise draw in U.S. supply would have almost no effect on the bearish tone.
Crude inventories are expected to rise for a fifth week running. The first of this week’s two supply reports, from the API, is due at 21:30 GMT.
Daily Technical Analysis
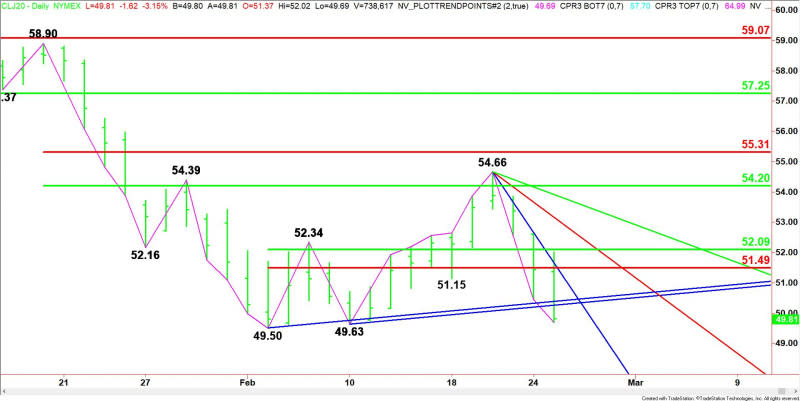
The main trend is up, but momentum has shifted to the downside. A trade through $49.63 will change the main trend to down. A move through $49.50 will reaffirm the downtrend. The main trend changes to up on a trade through $54.66.
The minor trend is down. It turned down on Monday when sellers took out $51.15. This shifted momentum to the downside.
The short-term range is $49.50 to $54.66. The market is currently trading on the weak side of its retracement zone at $51.49 to $52.09, making it resistance.
Daily Forecast
Based on Tuesday price action and the current price at $49.80, the direction of the April WTI crude oil market into the extended close is likely to be determined by trader reaction to a pair of uptrending Gann angles at $50.26 and $50.38.
Bearish Scenario
A sustained move under $50.26 will indicate the presence of sellers. If the downside momentum continues then look for the selling pressure to take out $49.63 and $49.50. This could trigger an acceleration to the downside with the December 24, 2018 main bottom at $45.92 the next likely downside target.
Bearish Scenario
Overcoming and sustaining a rally over $50.38 will signal the return of buyers. If the rally gains any traction then look for a possible test of a steep downtrending Gann angle at $51.66.
This article was originally posted on FX Empire
