
 Yahoo Finance
 Crude Oil Price Update – Bullish OPEC News Could Launch Move into $61.48
U.S. West Texas Intermediate crude oil futures are inching lower on Thursday. Volume is low as the OPEC talks begin in Vienna. Traders are hoping the major global producers agree to make further output cuts.
Prices are also being underpinned by yesterday government report that showed a larger than expected draw down in weekly inventories. Optimism over a trade deal is also providing support after President Trump said on Wednesday that the trade talks with China are going very well.
At 07:18 GMT, January WTI crude oil is trading $58.31, down $0.12 or – 0.21%.
Daily Swing Chart Technical Analysis
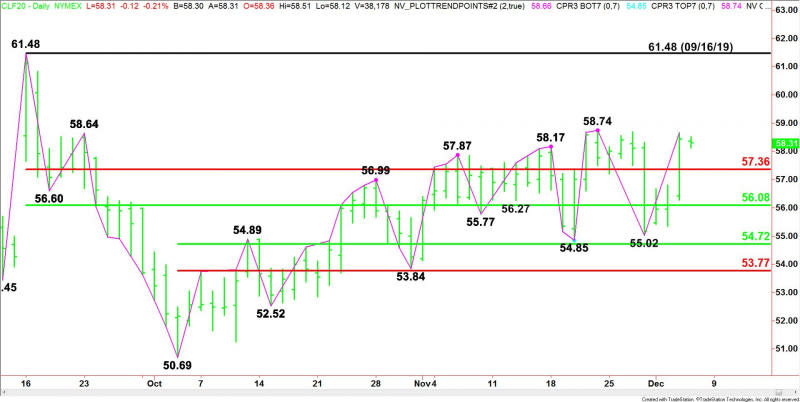
The main trend is up according to the daily swing chart. A trade through $58.74 will signal a resumption of the uptrend. A trade through $55.02 will change the main trend to down.
The main range is $61.48 to $50.69. Its retracement zone at $57.36 to $56.08 is support. Holding above this zone is helping to generate an upside bias.
The short-term range is $50.69 to $58.74. Its retracement zone at $54.72 to $53.77 is additional support.
Daily Swing Chart Technical Forecast
Today’s price action is likely to be news driven because of the start of the OPEC meeting.
If OPEC and its allies decide to cut production more than expected then look for a breakout over the last main top at $58.74. The daily chart shows there is plenty of room to the upside with the next major target the September 16 main top at $61.48.
If traders are disappointed by OPEC then look for a break into the Fibonacci level at $57.36. This is a potential trigger point for an acceleration to the downside with the next major target the 50% level at $56.08.
This article was originally posted on FX Empire
