
 Yahoo Finance
 Crude Oil Price Update – Main Trend Changes to Up on Trade Through $57.40
U.S. West Technical Intermediate crude oil futures are trading flat early Tuesday after posting a solid gain the previous session. Prices were supported on Monday by supply disruption worries after Yemen hit a Saudi Arabian oil field over the weekend, but the primary drivers of the price action were an easing of concerns over a U.S. recession and hopes of a quick resolution of the U.S.-China trade dispute. Gains were capped by last Friday’s bearish demand outlook from OPEC.
At 04:18 GMT, October WTI crude oil is trading $56.14, unchanged.
Daily Swing Chart Technical Analysis
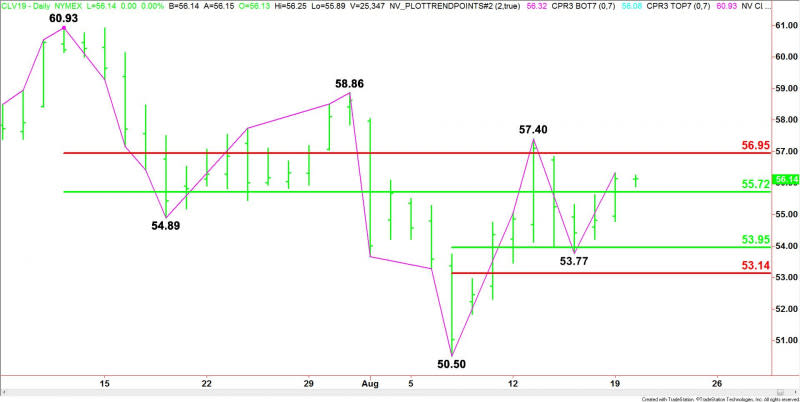
The main trend is down according to the daily swing chart, however, the formation of a secondary higher bottom indicates that momentum may have shifted to the upside.
A trade through $57.40 will change the main trend to up. A move through $53.77 will signal a resumption of the downtrend.
The main range is $60.93 to $50.50. Its retracement zone at $55.72 to $56.95 is controlling the near-term direction of the market. Crude oil is currently trading inside this zone.
The short-term range is $50.50 to $57.40. Its retracement zone at $53.95 to $53.14 is support. This zone stopped the selling at $53.77 on August 15.
Daily Swing Chart Technical Forecast
Based on Monday’s close at $56.14 and today’s early price action, the direction of the October WTI crude oil futures contract is likely to be determined by trader reaction to the main 50% level at $55.72.
Bullish Scenario
A sustained move over $55.72 will indicate the presence of buyers. If this move creates enough upside momentum then look for the buying to possibly extend into the main Fibonacci level at $56.95. Sellers could come in on the first test of this level, but if overcome, then look for the rally to possibly extend into the main top at $57.40. Taking out this top will change the main trend to up.
Bearish Scenario
A sustained move under $55.72 will signal the presence of sellers. The first minor target is a pivot at $55.05. If this fails, the selling pressure could extend into the short-term 50% level at $53.95 and the main bottom at $53.77. If the selling is strong enough to take out this bottom then look for a move into the short-term Fibonacci level at $53.14.
This article was originally posted on FX Empire
More From FXEMPIRE:
The Fiat Market Vs The Cryptocurrency Market: Competition or Partnership?
EUR/USD Daily Forecast – Euro Declines for Five Straight Sessions
USD/CAD Daily Forecast – 1.3345 Resistance Puting a Lid over Daily Gains
Gold Price Futures (GC) Technical Analysis – Trading on Weak Side of Minor Pivot at $1517.50
Will Companies Support Bitcoin the Way Retailers Supported It?
