
 Yahoo Finance
 Crude Oil Price Update – Strengthens Over $55.72, Weakens Under $53.95
U.S. West Texas Intermediate crude oil futures finished higher on Friday, but well off their lows. The market spiked early in the session as tensions eased over a U.S. recession following Thursday’s stronger than expected retail sales report. Traders were also optimistic that central banks would provide enough stimulus to prevent a global economic slowdown.
On Friday, October WTI crude oil settled at $54.81, up $0.39 or +0.72%.
Gains were capped and prices retreated throughout the session after OPEC provided a downbeat oil-market outlook for the rest of 2019 as economic growth slows and highlighted challenges in 2020 as rivals pump more, supporting the case for continuing the OPEC-led production cuts.
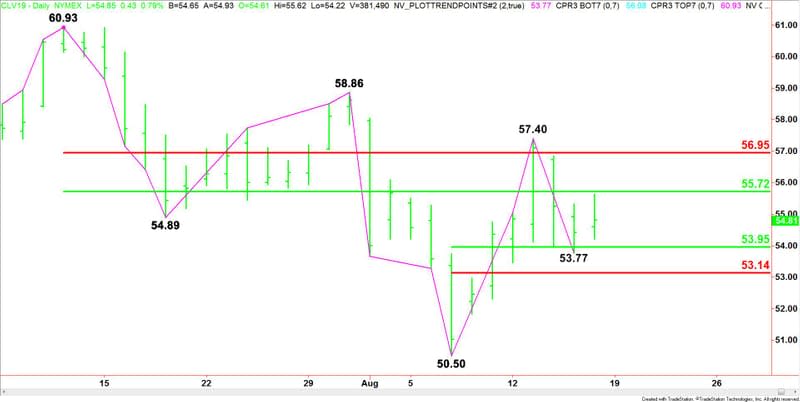
Daily Swing Chart Technical Analysis
The main trend is down according to the daily swing chart. A trade through $57.40 will change the main trend to up. A move through $50.50 will signal a resumption of the downtrend.
The minor trend is also down. A trade through $57.40 will change the minor trend to up. Taking out $53.77 will signal a resumption of the minor downtrend after several days of sideways-to-higher price action.
The main range is $60.93 to $50.50. Its retracement zone at $55.72 to $56.95 is resistance.
The minor range is $50.50 to $57.40. Its retracement zone at $53.95 to $53.14 is support. This zone stopped the selling at $53.77 on August 15.
Daily Swing Chart Technical Forecast
On Friday, October WTI crude oil settled between a pair of 50% levels at $53.95 and $55.72. Since the trend is down, we’ll look at it from the short-side perspective. Based on the close at $54.81, the direction of the market on Monday is likely to be determined by trader reaction to the main 50% level at $55.72.
Bearish Scenario
A sustained move under $55.72 will indicate the presence of sellers. The first downside target is the short-term 50% level at $53.95, followed closely by the minor bottom at $53.77. Taking out this level could drive the market into the Fibonacci level at $53.14.
The daily chart is wide open to the downside under $53.14 so this could be the trigger point for an acceleration to the downside with the next major target the main bottom at $50.50.
Bullish Scenario
Holding $53.95 will be the first sign of buyers, but taking out $55.72 will indicate the buying is getting stronger. If this move creates enough upside momentum then look for the rally to possibly extend into the main Fibonacci level at $56.95, followed closely by the main top at $57.40. Taking out this level will change the main trend to up.
This article was originally posted on FX Empire
More From FXEMPIRE:
Bitcoin Cash – ABC, Litecoin and Ripple Daily Analysis – 18/08/19
U.S. Dollar Index Futures (DX) Technical Analysis – Needs Weaker Euro to Sustain Rally into 98.70
USD/JPY Forex Technical Analysis – Establishing Support at 106.013 Could Fuel Rally into 107.183
US Stock Market Overview – Stocks Rally, but Finish the Week in the Red
Gold Price Futures (GC) Technical Analysis – Steep Drop Possible Under $1517.50