
 Yahoo Finance
 Crude Oil Price Update – Trend Up, but Momentum Shifted to Downside
July West Texas Intermediate crude oil futures are trading lower on Thursday. The market is being pressured by a number of factors including worries that OPEC will agree to increase production at its June meeting, rising U.S. inventories and increased U.S. production.
Daily Swing Chart Technical Analysis
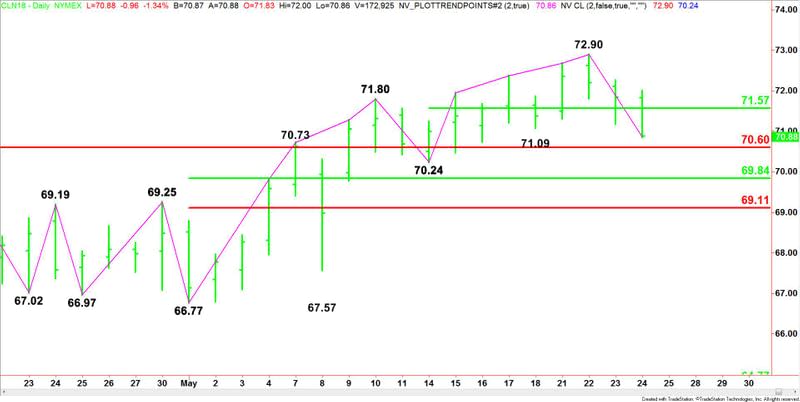
The main trend is up according to the daily swing chart, however, momentum shifted to the downside earlier today. A trade through $72.90 will signal a resumption of the uptrend.
The minor trend turned down when sellers took out the last minor bottom at $71.09. This also shifted momentum to the downside.
A trade through $70.24 will change the main trend to down.
The short-term range is $70.24 to $72.90. Its 50% level or pivot comes in at $71.57. Trading below this pivot helps support today’s downside bias.
The main range is $66.77 to $72.90. If the trend changes to down then look for the selling to extend into its retracement zone at $69.84 to $69.11.
Daily Swing Chart Technical Forecast
Based on the early price action, the direction of the crude oil market today is likely to be determined by trader reaction to the pivot at $71.57.
A sustained move under $71.57 will indicate the presence of sellers. This could trigger a move into a major Fibonacci level at $70.60. Since the main trend is up, we could see a technical bounce on the first test of this level.
If $70.60 fails as support then look for the selling to extend into the main bottom at $70.24 then the 50% level at $69.84.
A sustained move over $71.57 will signal the presence of buyers. This will shift momentum to the upside.
This article was originally posted on FX Empire
More From FXEMPIRE:
Natural Gas Price Fundamental Daily Forecast – Supported By Weather-Related Demand Expectations
EUR/USD, AUD/USD, GBP/USD and USD/JPY Daily Outlook – May 24, 2018
Gold Price Futures (GC) Technical Analysis – May 24, 2018 Forecast
E-mini Dow Jones Industrial Average (YM) Futures Analysis – May 24, 2018 Forecast
Corn Breaks Out to Fresh 2-year Highs Wheat and Soybeans Follow
