
 Yahoo Finance
 CVS Health Corp's Dividend Analysis
Assessing the Sustainability of CVS Health Corp's Dividend
CVS Health Corp (NYSE:CVS) recently announced a dividend of $0.67 per share, payable on 2024-05-01, with the ex-dividend date set for 2024-04-19. As investors look forward to this upcoming payment, the spotlight also shines on the company's dividend history, yield, and growth rates. Using the data from GuruFocus, let's look into CVS Health Corp's dividend performance and assess its sustainability.
What Does CVS Health Corp Do?
This Powerful Chart Made Peter Lynch 29% A Year For 13 Years
How to calculate the intrinsic value of a stock?
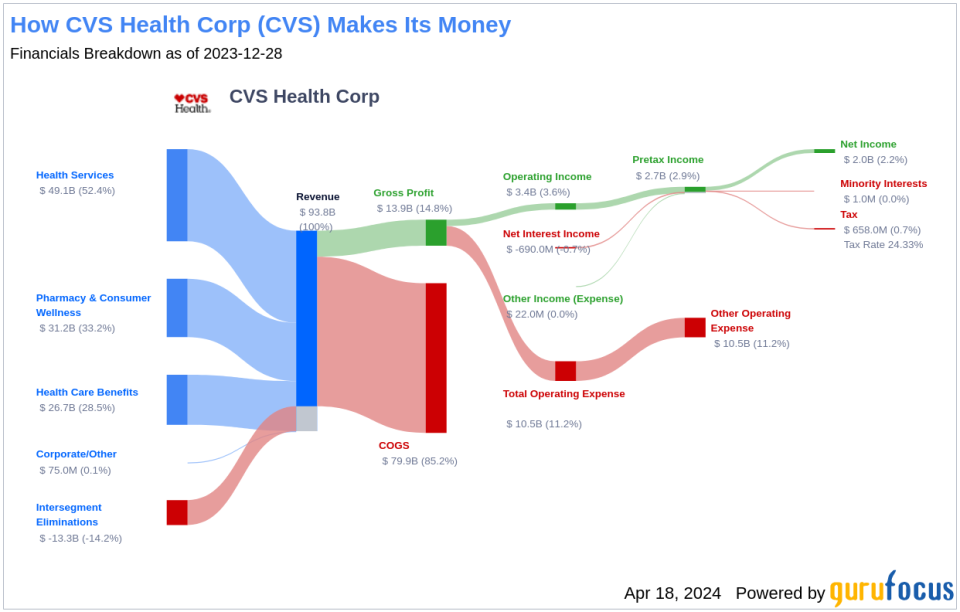
CVS Health offers a diverse set of healthcare services. Its roots are in its retail pharmacy operations, where it operates over 9,000 stores primarily in the U.S. CVS is also the largest pharmacy benefit manager (acquired through Caremark), processing over 2 billion adjusted claims annually. It also operates a top-tier health insurer (acquired through Aetna) where it serves about 26 million medical members. The company's recent acquisition of Oak Street adds primary care services to the mix, which could have significant synergies with all its existing business lines.
A Glimpse at CVS Health Corp's Dividend History
CVS Health Corp has maintained a consistent dividend payment record since 1986. Dividends are currently distributed on a quarterly basis. CVS Health Corp has increased its dividend each year since 1997. The stock is thus listed as a dividend aristocrat, an honor that is given to companies that have increased their dividend each year for at least the past 27 years. Below is a chart showing annual Dividends Per Share for tracking historical trends.
Breaking Down CVS Health Corp's Dividend Yield and Growth
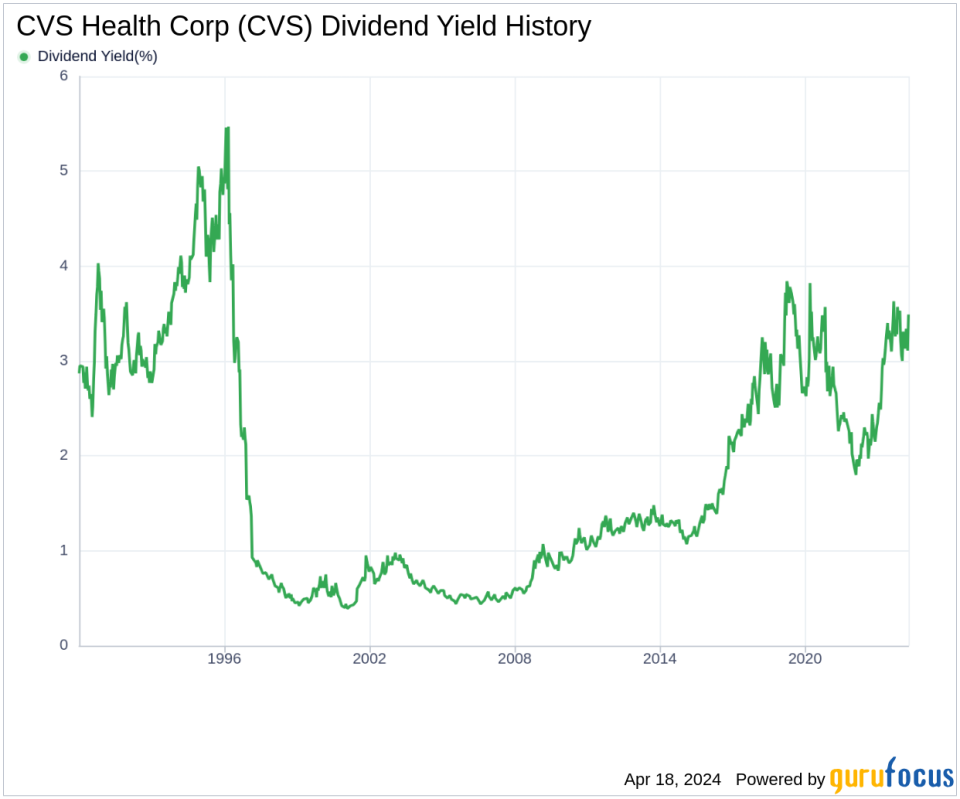
As of today, CVS Health Corp currently has a 12-month trailing dividend yield of 3.61% and a 12-month forward dividend yield of 3.89%. This suggests an expectation of increased dividend payments over the next 12 months.
Over the past three years, CVS Health Corp's annual dividend growth rate was 6.60%. Extended to a five-year horizon, this rate decreased to 3.60% per year. And over the past decade, CVS Health Corp's annual dividends per share growth rate stands at 8.60%.
Based on CVS Health Corp's dividend yield and five-year growth rate, the 5-year yield on cost of CVS Health Corp stock as of today is approximately 4.31%.
The Sustainability Question: Payout Ratio and Profitability
To assess the sustainability of the dividend, one needs to evaluate the company's payout ratio. The dividend payout ratio provides insights into the portion of earnings the company distributes as dividends. A lower ratio suggests that the company retains a significant part of its earnings, thereby ensuring the availability of funds for future growth and unexpected downturns. As of 2023-12-31, CVS Health Corp's dividend payout ratio is 0.32.
CVS Health Corp's profitability rank, offers an understanding of the company's earnings prowess relative to its peers. GuruFocus ranks CVS Health Corp's profitability 7 out of 10 as of 2023-12-31, suggesting good profitability prospects. The company has reported net profit in 9 years out of the past 10 years.
Growth Metrics: The Future Outlook
To ensure the sustainability of dividends, a company must have robust growth metrics. CVS Health Corp's growth rank of 7 out of 10 suggests that the company's growth trajectory is good relative to its competitors.
Revenue is the lifeblood of any company, and CVS Health Corp's revenue per share, combined with the 3-year revenue growth rate, indicates a strong revenue model. CVS Health Corp's revenue has increased by approximately 10.70% per year on average, a rate that underperforms approximately 63.16% of global competitors.
The company's 3-year EPS growth rate showcases its capability to grow its earnings, a critical component for sustaining dividends in the long run. During the past three years, CVS Health Corp's earnings increased by approximately 3.50% per year on average, a rate that underperforms approximately 57.89% of global competitors.
Lastly, the company's 5-year EBITDA growth rate of 13.80%, which underperforms approximately 33.33% of global competitors.
Conclusion: Evaluating CVS Health Corp's Dividend Prospects
Investors considering CVS Health Corp for its dividend should be encouraged by the company's history of consistent dividend payments and its status as a dividend aristocrat. With a solid payout ratio and a commendable profitability rank, CVS Health Corp appears to be in a good position to maintain its dividend payments. While some growth metrics indicate room for improvement, the overall picture suggests a company with a sustainable dividend outlook. As value investors, one might ponder if CVS Health Corp's current yield and growth prospects align with their investment strategy. Could CVS Health Corp be the right addition to a dividend-focused portfolio?
GuruFocus Premium users can screen for high-dividend yield stocks using the High Dividend Yield Screener.
This article, generated by GuruFocus, is designed to provide general insights and is not tailored financial advice. Our commentary is rooted in historical data and analyst projections, utilizing an impartial methodology, and is not intended to serve as specific investment guidance. It does not formulate a recommendation to purchase or divest any stock and does not consider individual investment objectives or financial circumstances. Our objective is to deliver long-term, fundamental data-driven analysis. Be aware that our analysis might not incorporate the most recent, price-sensitive company announcements or qualitative information. GuruFocus holds no position in the stocks mentioned herein.
This article first appeared on GuruFocus.
