
 Yahoo Finance
 Is Daejan Holdings Plc (LON:DJAN) Excessively Paying Its CEO?

Benzion S. Freshwater has been the CEO of Daejan Holdings Plc (LON:DJAN) since 1976. First, this article will compare CEO compensation with compensation at similar sized companies. After that, we will consider the growth in the business. Third, we'll reflect on the total return to shareholders over three years, as a second measure of business performance. This method should give us information to assess how appropriately the company pays the CEO.
See our latest analysis for Daejan Holdings
How Does Benzion S. Freshwater's Compensation Compare With Similar Sized Companies?
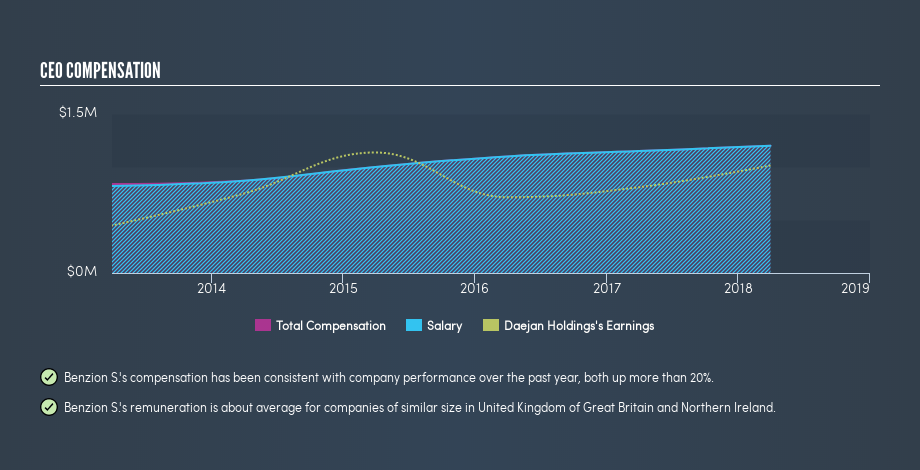
According to our data, Daejan Holdings Plc has a market capitalization of UK£929m, and pays its CEO total annual compensation worth UK£1.2m. (This is based on the year to March 2018). It is worth noting that the CEO compensation consists almost entirely of the salary, worth UK£1.2m. As part of our analysis we looked at companies in the same jurisdiction, with market capitalizations of UK£321m to UK£1.3b. The median total CEO compensation was UK£922k.
Thus we can conclude that Benzion S. Freshwater receives more in total compensation than the median of a group of companies in the same market, and of similar size to Daejan Holdings Plc. However, this doesn't necessarily mean the pay is too high. We can get a better idea of how generous the pay is by looking at the performance of the underlying business.
The graphic below shows how CEO compensation at Daejan Holdings has changed from year to year.
Is Daejan Holdings Plc Growing?
Over the last three years Daejan Holdings Plc has grown its earnings per share (EPS) by an average of 10% per year (using a line of best fit). Its revenue is up 2.7% over last year.
Overall this is a positive result for shareholders, showing that the company has improved in recent years. It's also good to see modest revenue growth, suggesting the underlying business is healthy. We don't have analyst forecasts, but you might want to assess this data-rich visualization of earnings, revenue and cash flow.
Has Daejan Holdings Plc Been A Good Investment?
With a total shareholder return of 4.9% over three years, Daejan Holdings Plc has done okay by shareholders. But they would probably prefer not to see CEO compensation far in excess of the median.
In Summary...
We examined the amount Daejan Holdings Plc pays its CEO, and compared it to the amount paid by similar sized companies. Our data suggests that it pays above the median CEO pay within that group.
However we must not forget that the EPS growth has been very strong over three years. We also note that, over the same time frame, shareholder returns haven't been bad. While it may be worth researching further, we don't see a problem with the CEO pay, given the good EPS growth. So you may want to check if insiders are buying Daejan Holdings shares with their own money (free access).
Important note: Daejan Holdings may not be the best stock to buy. You might find something better in this list of interesting companies with high ROE and low debt.
We aim to bring you long-term focused research analysis driven by fundamental data. Note that our analysis may not factor in the latest price-sensitive company announcements or qualitative material.
If you spot an error that warrants correction, please contact the editor at editorial-team@simplywallst.com. This article by Simply Wall St is general in nature. It does not constitute a recommendation to buy or sell any stock, and does not take account of your objectives, or your financial situation. Simply Wall St has no position in the stocks mentioned. Thank you for reading.
